Multiple Choice
Exhibit 2-5.The following data represent scores on a pop quiz in a statistics section: 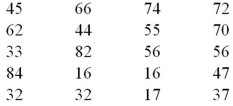 Refer to Exhibit 2-5.Suppose the data on quiz scores will be grouped into five classes.The width of the classes for a frequency distribution or histogram is closest to _____.
A) 10
B) 12
C) 14
D) 16
Correct Answer:

Verified
Correct Answer:
Verified
Q13: When constructing a scatterplot for two quantitative
Q41: The accompanying chart shows the numbers of
Q43: Exhibit 2-9.An analyst constructed the following frequency
Q44: Exhibit 2-8.Consider the following frequency distribution. <img
Q47: What type of relationship is indicated in
Q48: Exhibit 2-11.The accompanying relative frequency distribution represents
Q49: Exhibit 2-13.The organization of the Girl Sprouts
Q50: The accompanying chart shows the number of
Q51: A statistics instructor computes the grade and
Q69: A bar chart depicts the frequency or