Multiple Choice
What type of relationship is indicated in the scatterplot? 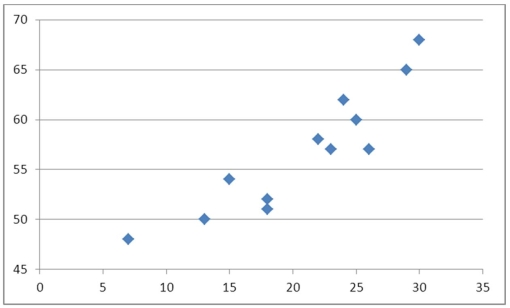
A) No relationship
B) A negative linear relationship
C) A negative curvilinear relationship
D) A positive linear or curvilinear relationship
Correct Answer:

Verified
Correct Answer:
Verified
Q13: When constructing a scatterplot for two quantitative
Q43: Exhibit 2-9.An analyst constructed the following frequency
Q44: Exhibit 2-8.Consider the following frequency distribution. <img
Q46: Exhibit 2-5.The following data represent scores on
Q48: Exhibit 2-11.The accompanying relative frequency distribution represents
Q49: Exhibit 2-13.The organization of the Girl Sprouts
Q50: The accompanying chart shows the number of
Q51: A statistics instructor computes the grade and
Q69: A bar chart depicts the frequency or
Q79: An ogive is a graph that plots