Multiple Choice
Exhibit 2-10.Automobiles traveling on a road with a posted speed limit of 65 miles per hour are checked for speed by a state police radar system.The following table is a frequency distribution of speeds. 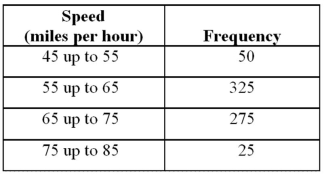 Refer to Exhibit 2-10.What proportion of the cars traveled at least 55 but less than 65 miles per hour?
A) 0.33
B) 0.48
C) 0.56
D) 0.80
Correct Answer:

Verified
Correct Answer:
Verified
Q9: A scatterplot is a graphical tool that
Q18: Exhibit 2-14.In the accompanying stem-and-leaf diagram,the values
Q19: Exhibit 2-4.Students in Professor Smith's Business Statistics
Q20: To approximate the width of a class
Q21: Exhibit 2-4.Students in Professor Smith's Business Statistics
Q22: Exhibit 2-11.The accompanying relative frequency distribution represents
Q24: What type of relationship is indicated in
Q25: Exhibit 2-7.Thirty students at Eastside High School
Q27: The following table shows analyst sentiment ratings
Q28: Exhibit 2-14.In the accompanying stem-and-leaf diagram,the values