Essay
A survey of 400 unemployed people was completed at a job fair.Each person was asked to categorize their job interests.The accompanying relative frequency distribution was constructed. 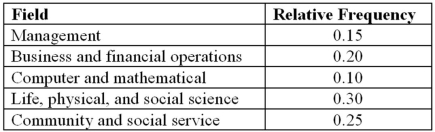 a.Construct the corresponding frequency distribution.How many of these people designated that the computer and mathematical industry was their job interest?
B)Construct a pie chart.
Correct Answer:

Verified
a.See the table below for freq...View Answer
Unlock this answer now
Get Access to more Verified Answers free of charge
Correct Answer:
Verified
View Answer
Unlock this answer now
Get Access to more Verified Answers free of charge
Q33: Exhibit 2-14.In the accompanying stem-and-leaf diagram,the values
Q34: Exhibit 2-4.Students in Professor Smith's Business Statistics
Q39: Use the following data to construct a
Q40: Exhibit 2-6.The following data represent the recent
Q41: The accompanying chart shows the numbers of
Q43: Exhibit 2-9.An analyst constructed the following frequency
Q59: What may be revealed from a scatterplot?<br>A)
Q69: A bar chart depicts the frequency or
Q110: A pie chart is a segmented circle
Q113: A polygon connects a series of neighboring