Multiple Choice
Use the following data to construct a scatterplot.What type of relationship is implied? 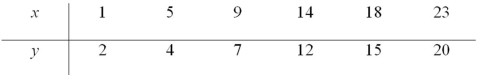
A) No relationship
B) A positive relationship
C) A negative relationship
D) Not enough information to answer
Correct Answer:

Verified
Correct Answer:
Verified
Related Questions
Q34: Exhibit 2-4.Students in Professor Smith's Business Statistics
Q38: A survey of 400 unemployed people was
Q40: Exhibit 2-6.The following data represent the recent
Q41: The accompanying chart shows the numbers of
Q43: Exhibit 2-9.An analyst constructed the following frequency
Q44: Exhibit 2-8.Consider the following frequency distribution. <img
Q59: What may be revealed from a scatterplot?<br>A)
Q69: A bar chart depicts the frequency or
Q110: A pie chart is a segmented circle
Q113: A polygon connects a series of neighboring