Multiple Choice
The accompanying chart shows the numbers of books written by each author in a collection of cookbooks.What type of chart is this? 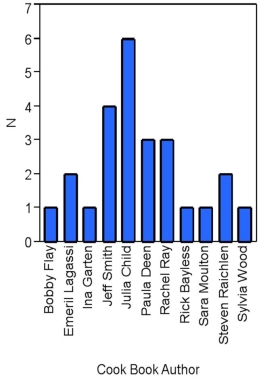
A) Bar chart for qualitative data
B) Bar chart for quantitative data
C) Frequency histogram for qualitative data
D) Frequency histogram for quantitative data
Correct Answer:

Verified
Correct Answer:
Verified
Q13: When constructing a scatterplot for two quantitative
Q38: A survey of 400 unemployed people was
Q39: Use the following data to construct a
Q40: Exhibit 2-6.The following data represent the recent
Q43: Exhibit 2-9.An analyst constructed the following frequency
Q44: Exhibit 2-8.Consider the following frequency distribution. <img
Q46: Exhibit 2-5.The following data represent scores on
Q59: What may be revealed from a scatterplot?<br>A)
Q69: A bar chart depicts the frequency or
Q113: A polygon connects a series of neighboring