Multiple Choice
Exhibit 2-6.The following data represent the recent sales price (in $1,000s) of 24 homes in a Midwestern city. 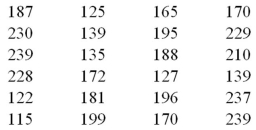 Refer to Exhibit 2-6.Suppose the data is grouped into five classes,and one of them will be "115 up to 140"- that is,{x;115 ≤ x < 140}.The relative frequency of this class is _____.
A) 6/24
B) 7/24
C) 6
D) 7
Correct Answer:

Verified
Correct Answer:
Verified
Q13: When constructing a scatterplot for two quantitative
Q38: A survey of 400 unemployed people was
Q39: Use the following data to construct a
Q41: The accompanying chart shows the numbers of
Q43: Exhibit 2-9.An analyst constructed the following frequency
Q44: Exhibit 2-8.Consider the following frequency distribution. <img
Q59: What may be revealed from a scatterplot?<br>A)
Q69: A bar chart depicts the frequency or
Q110: A pie chart is a segmented circle
Q113: A polygon connects a series of neighboring