Multiple Choice
Exhibit 2-9.An analyst constructed the following frequency distribution on the monthly returns for 50 selected stocks: 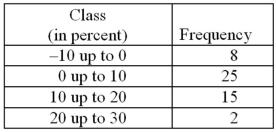 Refer to Exhibit 2-9.The number of stocks with returns of 0% up to 10% is ________.
A) 2
B) 8
C) 15
D) 25
Correct Answer:

Verified
Correct Answer:
Verified
Q13: When constructing a scatterplot for two quantitative
Q38: A survey of 400 unemployed people was
Q39: Use the following data to construct a
Q40: Exhibit 2-6.The following data represent the recent
Q41: The accompanying chart shows the numbers of
Q44: Exhibit 2-8.Consider the following frequency distribution. <img
Q46: Exhibit 2-5.The following data represent scores on
Q47: What type of relationship is indicated in
Q48: Exhibit 2-11.The accompanying relative frequency distribution represents
Q69: A bar chart depicts the frequency or