Short Answer
Exhibit 13.4
The following questions refer to the information and output below.
A grocery store can serve an average of 360 customers per hour. The service times are exponentially distributed. The store has 4 checkout lines each of which serves 90 customers per hour. Customers arrive at the store at a Poisson rate of 240 customers per hour. The following queuing analysis spreadsheet was developed from this information. 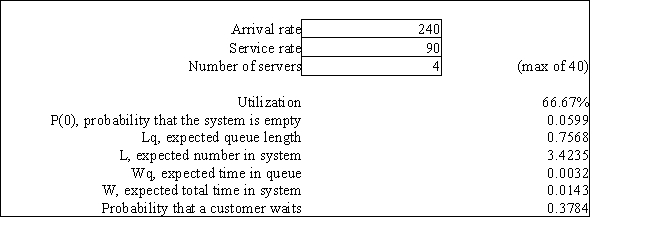
-Refer to Exhibit 13.4. Based on this report what percent of the time is a grocery clerk busy serving a customer?
Correct Answer:

Verified
Correct Answer:
Verified
Q87: Exhibit 13.2<br>The following questions refer to the
Q88: Exhibit 13.1<br>The following questions are based on
Q89: Exhibit 13.1<br>The following questions are based on
Q90: Exhibit 13.1<br>The following questions are based on
Q91: The customer service desk at Joe's Discount
Q92: Exhibit 13.2<br>The following questions refer to the
Q93: Exhibit 13.6<br>The following questions refer to the
Q94: Exhibit 13.1<br>The following questions are based on
Q95: Exhibit 13.3<br>The following questions refer to the
Q96: Exhibit 12.5<br>The following questions use the information