Multiple Choice
Automobiles traveling on a road with a posted speed limit of 65 miles per hour are checked for speed by a state police radar system.The following table is a frequency distribution of speeds. 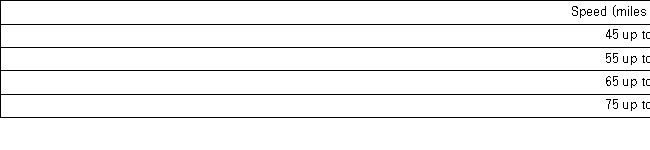 How many of the cars traveled less than 75 miles per hour?
A) 275
B) 325
C) 650
D) 675
Correct Answer:

Verified
Correct Answer:
Verified
Q9: A scatterplot is a graphical tool that
Q109: The shape of most data distributions can
Q113: In the accompanying stem-and-leaf diagram,the values in
Q114: A city in California spent $6 million
Q116: The following data represent scores on a
Q117: The accompanying relative frequency distribution represents the
Q118: The following data represent scores on a
Q119: An analyst constructed the following frequency distribution
Q120: The following data represent the recent sales
Q120: Frequency distributions may be used to describe