Multiple Choice
In the accompanying stem-and-leaf diagram,the values in the stem-and-leaf portions represent 10s and 1s digits,respectively. 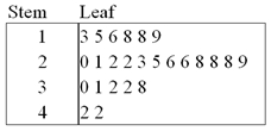 Find the frequency associated with data values that are more than 28.
A) 8
B) 9
C) 10
D) 11
Correct Answer:

Verified
Correct Answer:
Verified
Q59: What may be revealed from a scatterplot?<br>A)
Q62: For quantitative data, a relative frequency distribution
Q82: The dividend yields of the stocks in
Q83: Students in Professor Smith's business statistics course
Q84: A survey of 400 unemployed people was
Q85: Thirty students at Eastside High School took
Q86: The accompanying relative frequency distribution represents the
Q88: The following table shows analyst sentiment ratings
Q90: Consider the following frequency distribution. <img src="https://d2lvgg3v3hfg70.cloudfront.net/TB4266/.jpg"
Q91: Students in Professor Smith's business statistics course