Multiple Choice
Consider the following frequency distribution. 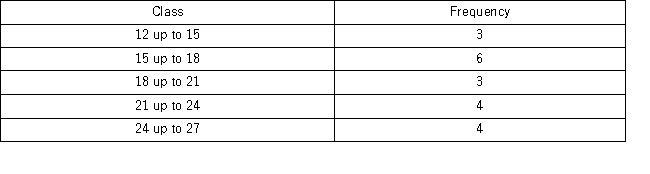 What proportion of the observations are less than 21?
A) 0.30
B) 0.60
C) 0.90
D) 1.00
Correct Answer:

Verified
Correct Answer:
Verified
Related Questions
Q42: A bar chart may be displayed horizontally.
Q59: What may be revealed from a scatterplot?<br>A)
Q62: For quantitative data, a relative frequency distribution
Q85: Thirty students at Eastside High School took
Q86: The accompanying relative frequency distribution represents the
Q87: In the accompanying stem-and-leaf diagram,the values in
Q88: The following table shows analyst sentiment ratings
Q91: Students in Professor Smith's business statistics course
Q93: In the following pie chart representing a
Q97: When constructing a frequency distribution for quantitative