Essay
The following table shows analyst sentiment ratings for the 30 stocks listed in the Dow Jones Industrial Average. 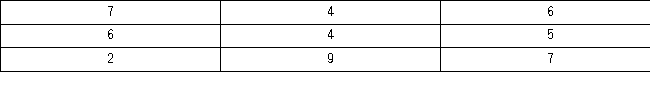 a.Construct a frequency distribution,relative frequency distribution,cumulative frequency distribution and relative cumulative frequency distribution using classes of 2 up to 4,4 up to 6,6 up to 8,and 8 up to 10.
b.Construct a histogram that summarizes the data.
c.What percentage of the stocks in the Dow Jones Industrial Average received a sentiment rating less than 8?
d.What percentage of the stocks in the Dow Jones Industrial Average received a sentiment rating of 6 or more?
Correct Answer:

Verified
c.23/30 ≈ 0.77 or about 77%.Se...View Answer
Unlock this answer now
Get Access to more Verified Answers free of charge
Correct Answer:
Verified
View Answer
Unlock this answer now
Get Access to more Verified Answers free of charge
Q59: What may be revealed from a scatterplot?<br>A)
Q62: For quantitative data, a relative frequency distribution
Q83: Students in Professor Smith's business statistics course
Q84: A survey of 400 unemployed people was
Q85: Thirty students at Eastside High School took
Q86: The accompanying relative frequency distribution represents the
Q87: In the accompanying stem-and-leaf diagram,the values in
Q90: Consider the following frequency distribution. <img src="https://d2lvgg3v3hfg70.cloudfront.net/TB4266/.jpg"
Q91: Students in Professor Smith's business statistics course
Q93: In the following pie chart representing a