Exam 4: Regression Models
Exam 1: Introduction to Quantitative Analysis96 Questions
Exam 2: Probability Concepts and Applications155 Questions
Exam 3: Decision Analysis128 Questions
Exam 4: Regression Models129 Questions
Exam 5: Forecasting138 Questions
Exam 6: Inventory Control Models147 Questions
Exam 7: Linear Programming Models: Graphical and Computer Methods141 Questions
Exam 8: Linear Programming Applications89 Questions
Exam 9: Transportation, Assignment, and Network Models112 Questions
Exam 10: Integer Programming, Goal Programming, and Nonlinear Programming86 Questions
Exam 11: Project Management142 Questions
Exam 12: Waiting Lines and Queuing Theory Models127 Questions
Exam 13: Simulation Modeling94 Questions
Exam 14: Markov Analysis103 Questions
Exam 15: Statistical Quality Control96 Questions
Exam 16: Analytic Hierarchy Process66 Questions
Exam 17: Dynamic Programming86 Questions
Exam 18: Decision Theory and the Normal Distribution62 Questions
Exam 19: Game Theory59 Questions
Exam 20: Mathematical Tools: Determinants and Matrices104 Questions
Exam 21: Calculus-Based Optimization39 Questions
Exam 22: Linear Programming: The Simplex Method98 Questions
Exam 23: Transportation, Assignment, and Network Algorithms120 Questions
Select questions type
The best model is a statistically significant model with a high r-square and few variables.
(True/False)
4.8/5  (36)
(36)
Which of these statements about multiple regression is best?
(Multiple Choice)
4.8/5 (39)
If the assumptions of regression have been met, errors plotted against the independent variable will typically show patterns.
(True/False)
4.8/5 (36)
The coefficients of each independent variable in a multiple regression model represent slopes.
(True/False)
4.8/5 (32)
An automated process to systematically add or delete independent variables from a regression model is called
(Multiple Choice)
4.9/5 (41)
A large international sales organization has collected data on the number of employees and the annual gross sales during the last 7 years.
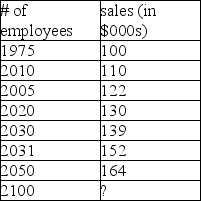 (a)Develop a scatter diagram.
(b)Determine the correlation coefficient.
(c)Determine the coefficient of determination.
(d)Determine the least squares trend line.
(e)Determine the predicted value of sales for 2100 employees.
(a)Develop a scatter diagram.
(b)Determine the correlation coefficient.
(c)Determine the coefficient of determination.
(d)Determine the least squares trend line.
(e)Determine the predicted value of sales for 2100 employees.
(Essay)
4.8/5 (40)
The value of r2 can never decrease when more variables are added to the model.
(True/False)
4.8/5 (28)
A large school district is reevaluating its teachers' salaries.They have decided to use regression analysis to predict mean teacher salaries at each elementary school.The researcher uses years of experience to predict salary.The raw data is given in the table below.The resulting equation was:
Y = 19389.21 + 1330.12X, where Y = salary and X = years of experience
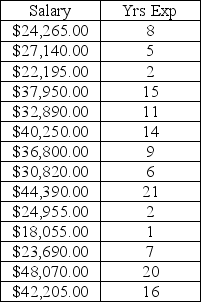 (a)Develop a scatter diagram.
(b)What is the correlation coefficient?
(c)What is the coefficient of determination?
(a)Develop a scatter diagram.
(b)What is the correlation coefficient?
(c)What is the coefficient of determination?
(Essay)
4.9/5 (32)
A healthcare executive is using regression to predict total revenues.She has decided to include both patient length of stay and insurance type in her model.Insurance type can be grouped into the following categories: Medicare, Medicaid, Managed Care, Self-Pay, and Charity.Which of the following is true?
(Multiple Choice)
4.8/5 (29)
Which of the following is not a common pitfall of regression?
(Multiple Choice)
4.9/5 (31)
A study was done to determine the relationship between GPA and starting salaries for college graduates.The data is shown in the table below:
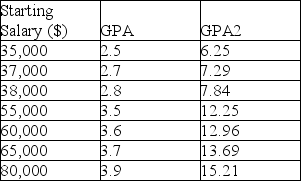 Use model building to determine the best fit based on highest adjusted r2.
(Essay)
4.8/5 (38)
Filters
- Essay(0)
- Multiple Choice(0)
- Short Answer(0)
- True False(0)
- Matching(0)