Exam 2: Observing and Explaining the Economy
Exam 1: The Central Idea156 Questions
Exam 2: Observing and Explaining the Economy143 Questions
Exam 3: The Supply and Demand Model166 Questions
Exam 4: Subtleties of the Supply and Demand Model176 Questions
Exam 5: The Demand Curve and the Behavior of Consumers176 Questions
Exam 6: The Supply Curve and the Behavior of Firms179 Questions
Exam 7: The Efficiency of Markets163 Questions
Exam 8: Costs and the Changes at Firms Over Time191 Questions
Exam 9: The Rise and Fall of Industries139 Questions
Exam 10: Monopoly184 Questions
Exam 11: Product Differentiation, Monopolistic Competition, and Oligopoly169 Questions
Exam 12: Antitrust Policy and Regulation152 Questions
Exam 13: Labor Markets179 Questions
Exam 14: Taxes, Transfers, and Income Distribution179 Questions
Exam 15: Public Goods, Externalities, and Government Behavior197 Questions
Exam 16: Capital and Financial Markets188 Questions
Exam 17: Macroeconomics: the Big Picture159 Questions
Exam 18: Measuring the Production, Income, and Spending of Nations177 Questions
Exam 19: The Spending Allocation Model166 Questions
Exam 20: Unemployment and Employment212 Questions
Exam 21: Productivity and Economic Growth162 Questions
Exam 22: Money and Inflation153 Questions
Exam 23: The Nature and Causes of Economic Fluctuations185 Questions
Exam 24: The Economic Fluctuations Model205 Questions
Exam 25: Using the Economic Fluctuations Model176 Questions
Exam 26: Fiscal Policy138 Questions
Exam 27: Monetary Policy180 Questions
Exam 28: Economic Growth Around the World157 Questions
Exam 29: International Trade242 Questions
Exam 30: International Finance125 Questions
Select questions type
Exhibit 2A-7 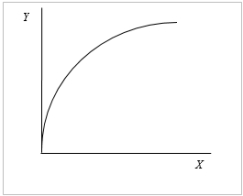 -Exhibit 2A-7 shows the relationship between X and Y. The slope of the relationship is
(Multiple Choice)
4.9/5  (31)
(31)
Exhibit 2A-5
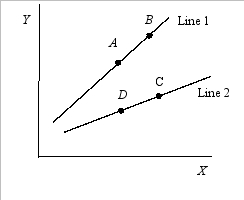 -Refer to Exhibit 2A-5. Which of the following would best explain the shift from line 1 to line 2?
(Multiple Choice)
4.7/5 (32)
Explain how economic models are similar to and different from models used in other sciences. What are the consequences of these differences?
(Essay)
4.9/5 (36)
Exhibit 2A-4 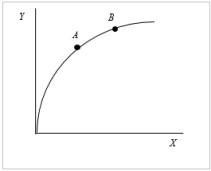 -Refer to Exhibit 2A-4. Which of the following statements is true?
(Multiple Choice)
4.7/5 (30)
A positive relationship represents a situation where an increase in one variable is associated with an increase in the other variable. Draw three graphs that represent a positive relationship.
(Essay)
4.9/5 (28)
Exhibit 2A-8 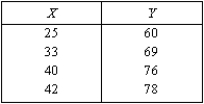 -The slope of the relationship between X and Y is positive in Exhibit 2A-8.
(True/False)
4.8/5 (33)
Economic data always give an accurate picture of what affects consumers.
(True/False)
4.9/5 (34)
When economists explain the relationship between the price of hotdogs and the number that consumers will buy, the ceteris paribus assumption implies that
(Multiple Choice)
4.9/5 (35)
To determine causality in many sciences such as physics, researchers
(Multiple Choice)
4.7/5 (36)
Exhibit 2A-4
-Refer to Exhibit 2A-4. The slope of the relationship between X and Y is
(Multiple Choice)
4.7/5 (28)
A good explanation for why people believe economists always disagree is that
(Multiple Choice)
4.8/5 (41)
Filters
- Essay(0)
- Multiple Choice(0)
- Short Answer(0)
- True False(0)
- Matching(0)