Exam 2: Observing and Explaining the Economy
Exam 1: The Central Idea156 Questions
Exam 2: Observing and Explaining the Economy143 Questions
Exam 3: The Supply and Demand Model166 Questions
Exam 4: Subtleties of the Supply and Demand Model176 Questions
Exam 5: The Demand Curve and the Behavior of Consumers176 Questions
Exam 6: The Supply Curve and the Behavior of Firms179 Questions
Exam 7: The Efficiency of Markets163 Questions
Exam 8: Costs and the Changes at Firms Over Time191 Questions
Exam 9: The Rise and Fall of Industries139 Questions
Exam 10: Monopoly184 Questions
Exam 11: Product Differentiation, Monopolistic Competition, and Oligopoly169 Questions
Exam 12: Antitrust Policy and Regulation152 Questions
Exam 13: Labor Markets179 Questions
Exam 14: Taxes, Transfers, and Income Distribution179 Questions
Exam 15: Public Goods, Externalities, and Government Behavior197 Questions
Exam 16: Capital and Financial Markets188 Questions
Exam 17: Macroeconomics: the Big Picture159 Questions
Exam 18: Measuring the Production, Income, and Spending of Nations177 Questions
Exam 19: The Spending Allocation Model166 Questions
Exam 20: Unemployment and Employment212 Questions
Exam 21: Productivity and Economic Growth162 Questions
Exam 22: Money and Inflation153 Questions
Exam 23: The Nature and Causes of Economic Fluctuations185 Questions
Exam 24: The Economic Fluctuations Model205 Questions
Exam 25: Using the Economic Fluctuations Model176 Questions
Exam 26: Fiscal Policy138 Questions
Exam 27: Monetary Policy180 Questions
Exam 28: Economic Growth Around the World157 Questions
Exam 29: International Trade242 Questions
Exam 30: International Finance125 Questions
Select questions type
Using gasoline prices as an example, explain what a normative statement is and what a positive statement is.
(Essay)
4.8/5  (36)
(36)
Explain how the distinction between positive and normative economics provides insight as to why economists do disagree.
(Essay)
5.0/5 (30)
Economists develop new models only when new economic data become available.
(True/False)
4.8/5 (35)
Exhibit 2-2 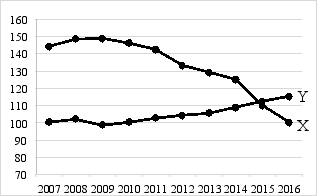 -Exhibit 2-2 shows the relationship between X and Y between 2007 and 2016. Suppose this correlation between X and Y continues to hold for the next 10 years. If Y declines over the period 2017 through 2020, we would expect
(Multiple Choice)
4.8/5 (40)
Exhibit 2-3
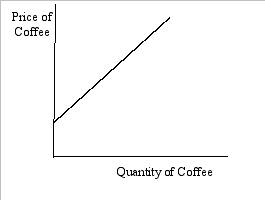 -In Exhibit 2-3, an example of a constant would be
(Multiple Choice)
4.8/5 (31)
An economic model is a tool used to help us understand the real world.
(True/False)
4.9/5 (29)
Identify whether the following issues are macroeconomic or microeconomic and explain why you categorized them in that way.

(Essay)
4.8/5 (41)
It has been documented that beer consumption rises when the unemployment rate rises. To conclude that this correlation means that increased unemployment causes increased beer consumption is to mistake correlation for causality.
(True/False)
4.8/5 (30)
A microeconomic model must be much smaller in size than a macroeconomic model.
(True/False)
4.9/5 (40)
To argue that economics is a partisan policy tool means that
(Multiple Choice)
4.8/5 (31)
Exhibit 2A-2 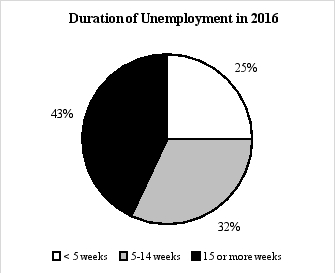 -Suppose in 2016, on average, 10 million people were unemployed. According to Exhibit 2A-2, how many of these people had been unemployed for less than five weeks?
(Multiple Choice)
4.8/5 (30)
What problems would arise if economists did not make ceteris paribus assumptions when making predictions?
(Essay)
4.9/5 (30)
Exhibit 2A-2
-The type of chart shown in Exhibit 2A-2 is referred to as a
(Multiple Choice)
5.0/5 (22)
Exhibit 2A-8 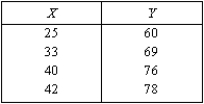 -There is a linear relationship between X and Y in Exhibit 2A-8.
(True/False)
4.8/5 (37)
If two variables are correlated, then it must be true that one of the variables causes the other.
(True/False)
4.8/5 (28)
Filters
- Essay(0)
- Multiple Choice(0)
- Short Answer(0)
- True False(0)
- Matching(0)