Exam 14: Markov Analysis
Exam 1: Introduction to Quantitative Analysis71 Questions
Exam 2: Probability Concepts and Applications157 Questions
Exam 3: Decision Analysis128 Questions
Exam 4: Regression Models133 Questions
Exam 5: Forecasting111 Questions
Exam 6: Inventory Control Models123 Questions
Exam 7: Linear Programming Models: Graphical and Computer Methods110 Questions
Exam 8: Linear Programming Applications105 Questions
Exam 9: Transportation,assignment,and Network Models98 Questions
Exam 10: Integer Programming,goal Programming,and Nonlinear Programming98 Questions
Exam 11: Project Management134 Questions
Exam 12: Waiting Lines and Queuing Theory Models145 Questions
Exam 13: Simulation Modeling79 Questions
Exam 14: Markov Analysis86 Questions
Exam 15: Statistical Quality Control98 Questions
Exam 16: Analytic Hierarchy Process53 Questions
Exam 17: Dynamic Programming67 Questions
Exam 18: Decision Theory and the Normal Distribution50 Questions
Exam 19: Game Theory47 Questions
Exam 20: Mathematical Tools: Determinants and Matrices99 Questions
Exam 21: Calculus-Based Optimization24 Questions
Exam 22: Linear Programming: The Simplex Method100 Questions
Exam 23: Transportation, Assignment, and Network Algorithms111 Questions
Select questions type
Markov analysis assumes that there are a limited number of states in the system.
(True/False)
4.8/5  (39)
(39)
Table 14-2
The following data consists of a matrix of transition probabilities (P)of three competing retailers,the initial market share π(0).Assume that each state represents a retailer (Retailer 1,Retailer 2,Retailer 3,respectively)and the transition probabilities represent changes from one month to the next.
P =  π(0)= (0.3,0.6,0.1)
-Using the data given in Table 14-2,find the market shares for the three retailers in month 2.
π(0)= (0.3,0.6,0.1)
-Using the data given in Table 14-2,find the market shares for the three retailers in month 2.
(Multiple Choice)
5.0/5 (33)
Table 14-3
The following data consists of a matrix of transition probabilities (P)of three office locations (A,B,C)within a large company and how employees shift from one location to the other from year to year.The company CEO would like to understand the movement of employees over time and the long-run proportion of employees in each location.Assume that there is always a total of 3000 employees.
A B C
P = ![Table 14-3 The following data consists of a matrix of transition probabilities (P)of three office locations (A,B,C)within a large company and how employees shift from one location to the other from year to year.The company CEO would like to understand the movement of employees over time and the long-run proportion of employees in each location.Assume that there is always a total of 3000 employees. A B C P = π(0)= [1000,1000,1000] <sub> </sub><sub> </sub> -Using the data given in Table 14-3,how many employees do we expect in location B two years from now?](https://storage.examlex.com/TB2950/11eabb83_5a40_619b_b8db_d18cdc104bec_TB2950_11_TB2950_11_TB2950_11_TB2950_11_TB2950_11.jpg)
![Table 14-3 The following data consists of a matrix of transition probabilities (P)of three office locations (A,B,C)within a large company and how employees shift from one location to the other from year to year.The company CEO would like to understand the movement of employees over time and the long-run proportion of employees in each location.Assume that there is always a total of 3000 employees. A B C P = π(0)= [1000,1000,1000] <sub> </sub><sub> </sub> -Using the data given in Table 14-3,how many employees do we expect in location B two years from now?](https://storage.examlex.com/TB2950/11eabb83_5a40_88ac_b8db_cb9f435fda4b_TB2950_11_TB2950_11_TB2950_11_TB2950_11_TB2950_11.jpg) π(0)= [1000,1000,1000]
-Using the data given in Table 14-3,how many employees do we expect in location B two years from now?
π(0)= [1000,1000,1000]
-Using the data given in Table 14-3,how many employees do we expect in location B two years from now?
(Multiple Choice)
4.8/5 (33)
Table 14-3
The following data consists of a matrix of transition probabilities (P)of three office locations (A,B,C)within a large company and how employees shift from one location to the other from year to year.The company CEO would like to understand the movement of employees over time and the long-run proportion of employees in each location.Assume that there is always a total of 3000 employees.
A B C
P = π(0)= [1000,1000,1000]
-Using the data given in Table 14-3,how many employees do we expect in location A one year from now?
(Multiple Choice)
4.7/5 (40)
A certain utility firm has noticed that a residential customer's bill for one month is dependent on the previous month's bill.The observations are summarized in the following transition matrix. 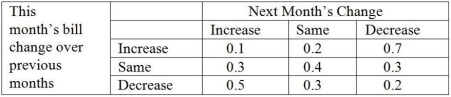 The utility company would like to know the long-run probability that a customer's bill will increase,the probability the bill will stay the same,and the probability the bill will decrease.
(Essay)
4.8/5 (33)
Table 14-4
Cuthbert Wylinghauser is a scheduler of transportation for the state of Delirium.This state contains three cities: Chaos (C1),Frenzy (C2),and Tremor (C3).A transition matrix,indicating the probability that a resident in one city will travel to another,is given below.Cuthbert's job is to schedule the required number of seats,one to each person making the trip (transition),on a daily basis.
C F T
Transition matix: ![Table 14-4 Cuthbert Wylinghauser is a scheduler of transportation for the state of Delirium.This state contains three cities: Chaos (C<sub>1</sub>),Frenzy (C<sub>2</sub>),and Tremor (C<sub>3</sub>).A transition matrix,indicating the probability that a resident in one city will travel to another,is given below.Cuthbert's job is to schedule the required number of seats,one to each person making the trip (transition),on a daily basis. C F T Transition matix: π(0)= [100,100,100] <sub> </sub> -Using the data given in Table 14-4,find the equilibrium travel population for Frenzy (rounded to the nearest whole person).](https://storage.examlex.com/TB2950/11eabb83_5a40_afbd_b8db_53b2343a2a2c_TB2950_11_TB2950_11_TB2950_11_TB2950_11.jpg)
![Table 14-4 Cuthbert Wylinghauser is a scheduler of transportation for the state of Delirium.This state contains three cities: Chaos (C<sub>1</sub>),Frenzy (C<sub>2</sub>),and Tremor (C<sub>3</sub>).A transition matrix,indicating the probability that a resident in one city will travel to another,is given below.Cuthbert's job is to schedule the required number of seats,one to each person making the trip (transition),on a daily basis. C F T Transition matix: π(0)= [100,100,100] <sub> </sub> -Using the data given in Table 14-4,find the equilibrium travel population for Frenzy (rounded to the nearest whole person).](https://storage.examlex.com/TB2950/11eabb83_5a40_afbe_b8db_03f184162790_TB2950_11_TB2950_11_TB2950_11_TB2950_11.jpg) π(0)= [100,100,100]
-Using the data given in Table 14-4,find the equilibrium travel population for Frenzy (rounded to the nearest whole person).
π(0)= [100,100,100]
-Using the data given in Table 14-4,find the equilibrium travel population for Frenzy (rounded to the nearest whole person).
(Multiple Choice)
4.8/5 (43)
Table 14-2
The following data consists of a matrix of transition probabilities (P)of three competing retailers,the initial market share π(0).Assume that each state represents a retailer (Retailer 1,Retailer 2,Retailer 3,respectively)and the transition probabilities represent changes from one month to the next.
P = π(0)= (0.3,0.6,0.1)
-Using the data given in Table 14-2,find the market shares for the three retailers in month 1.
(Multiple Choice)
4.9/5 (40)
The probabilities in any column of the matrix of transition probabilities will always sum to one.
(True/False)
4.9/5 (49)
There is a 30% chance that any current client of company A will switch to company B this year.There is a 40% chance that any client of company B will switch to company A this year.If these probabilities are stable over the years,and if company A has 500 clients and company B has 300 clients,
(a)how many clients will each company have next year?
(b)how many clients will each company have in two years?
(Essay)
4.9/5 (42)
Given the following matrix of transition probabilities,find the equilibrium states. 
(Essay)
4.7/5 (36)
The vector of state probabilities for period n is (0.4,0.6).The accompanying matrix of transition probabilities is:  Calculate the vector of state probabilities for period n+1.
(Essay)
4.8/5 (37)
The probability that we will be in a future state,given a current or existing state,is called
(Multiple Choice)
4.9/5 (38)
Table 14-2
The following data consists of a matrix of transition probabilities (P)of three competing retailers,the initial market share π(0).Assume that each state represents a retailer (Retailer 1,Retailer 2,Retailer 3,respectively)and the transition probabilities represent changes from one month to the next.
P = π(0)= (0.3,0.6,0.1)
-Using the data given in Table 14-2,what is the equilibrium market share?
(Multiple Choice)
5.0/5 (40)
The vector of state probabilities for any period is equal to the vector of state probabilities for the preceding period multiplied by the matrix of transition probabilities.
(True/False)
4.9/5 (35)
Table 14-1
The following data consists of a matrix of transition probabilities (P)of three competing companies,and the initial market share π(0).Assume that each state represents a company (Company 1,Company 2,Company 3,respectively)and the transition probabilities represent changes from one month to the next.
P =  π(0)= (0.3,0.6,0.1)
-Using the data in Table 14-1,and assuming that the transition probabilities do not change,in the long run what market share would Company 2 expect to reach? (Rounded to two decimal places. )
π(0)= (0.3,0.6,0.1)
-Using the data in Table 14-1,and assuming that the transition probabilities do not change,in the long run what market share would Company 2 expect to reach? (Rounded to two decimal places. )
(Multiple Choice)
4.8/5 (30)
In Markov analysis it is assumed that states are both mutually exclusive and collectively exhaustive.
(True/False)
4.7/5 (24)
Three fast food hamburger restaurants are competing for the college lunch crowd.Burger Bills has 40% of the market while Hungry Heifer and Salty Sams each have 30% of the market.Burger Bills loses 10 % of its customers to Hungry Heifer and 10% to Salty Sams each month.Hungry Heifer loses 5% of its customers to Burger Bills and 10% to Salty Sams each month.Salty Sams loses 10% of its customers to Burger Bills while 20% go to Hungry Heifer.What will the market shares be for the three businesses next month?
(Essay)
4.8/5 (33)
Filters
- Essay(0)
- Multiple Choice(0)
- Short Answer(0)
- True False(0)
- Matching(0)