Exam 10: Decision Models With Uncertainty and Risk
Exam 1: Data and Business Decisions93 Questions
Exam 2: Descriptive Statistics and Data Analysis99 Questions
Exam 3: Probability Concepts and Distributions111 Questions
Exam 4: Sampling and Estimation123 Questions
Exam 5: Hypothesis Testing and Statistical Inference99 Questions
Exam 6: Regression Analysis93 Questions
Exam 7: Forecasting100 Questions
Exam 8: Introduction to Statistical Quality Control101 Questions
Exam 9: Building and Using Decision Models74 Questions
Exam 10: Decision Models With Uncertainty and Risk90 Questions
Exam 11: Decisions, uncertainty, and Risk100 Questions
Exam 12: Queues and Process Simulation Modeling97 Questions
Exam 13: Linear Optimization98 Questions
Exam 14: Integer, nonlinear, and Advanced Optimization Methods100 Questions
Select questions type
Use the data set shown below to answer the following question(s). 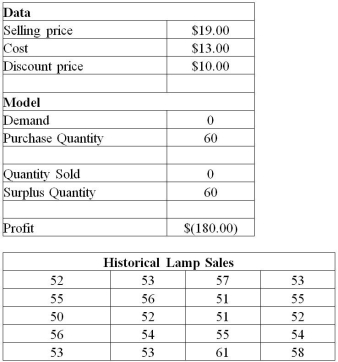
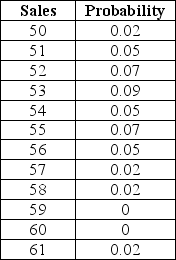 For this Newsvendor model,fit a distribution with Crystal Ball and use the Decision Table tool for analysis.Use 5,000 trials for the simulation.
-Using Crystal Ball for the data set shown above,identify the purchase quantity that provides the largest average profit.
For this Newsvendor model,fit a distribution with Crystal Ball and use the Decision Table tool for analysis.Use 5,000 trials for the simulation.
-Using Crystal Ball for the data set shown above,identify the purchase quantity that provides the largest average profit.
(Multiple Choice)
4.7/5  (35)
(35)
Explain instances where we have to use the Bootstrap tool in Crystal Ball.
(Essay)
4.9/5 (40)
In the analytical approach,if more than one critical path exists in a project management model,the path with the ________ is used.
(Multiple Choice)
4.9/5 (31)
In the analytical approach,the probabilities of completing the project within a certain time are computed assuming that ________.
(Multiple Choice)
4.8/5 (30)
Determine the approximate cumulative profit that Captain Jack Automobiles is likely to realize with a probability of 0.20 in the third year.
(Multiple Choice)
4.9/5 (35)
With the inherent uncertainty in sales forecasts,________ is an appropriate tool to analyze cash budgets.
(Multiple Choice)
4.8/5 (37)
From the forecast charts for accepting 210 reservations,using the above data,there is about a(n)________ chance of overbooking at least one customer.
(Multiple Choice)
4.9/5 (41)
If a simulation has multiple related forecasts,the ________ feature in Crystal Ball allows an individual to superimpose the frequency data from selected forecasts on one chart in order to compare differences and similarities that might not be apparent.
(Multiple Choice)
4.8/5 (48)
Use the data set shown below to answer the following question(s). 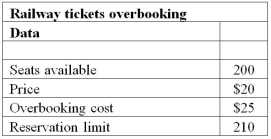 The demand at the ticket booking center can be modeled by a Poisson distribution with a mean of 220.Assume that each reservation has a constant probability of p = 0.02 of being cancelled.Use Crystal Ball functions for the model.
-For the data given above,which of the following Crystal Ball functions determines the customer demand?
The demand at the ticket booking center can be modeled by a Poisson distribution with a mean of 220.Assume that each reservation has a constant probability of p = 0.02 of being cancelled.Use Crystal Ball functions for the model.
-For the data given above,which of the following Crystal Ball functions determines the customer demand?
(Multiple Choice)
4.9/5 (30)
The ________ in Crystal Ball is used to define an assumption based on the empirical distribution of the data.
(Multiple Choice)
4.9/5 (42)
An individual using Crystal Ball can choose to use the same sequence of random numbers for generating the random variates in the assumption cells.The above mentioned function can be found in the ________.
(Multiple Choice)
4.8/5 (29)
The spider chart shows the results as rates of change; ________.
(Multiple Choice)
4.9/5 (38)
For the given data set,the probability of a positive NPV value over the five years is ________.
(Multiple Choice)
4.8/5 (35)
In a forecast chart provided by Crystal Ball for the cumulative net profit of a particular year,you intend to find the chances that the forecast value will show a cumulative profit in that particular year.In this scenario,you should ________.
(Multiple Choice)
4.8/5 (35)
________ is the probability of occurrence of an undesirable outcome.
(Multiple Choice)
4.8/5 (32)
Prior to running the simulation,using the Tornado Chart tool in Crystal Ball,for assumptions,creates two charts; a tornado chart and a ________.
(Multiple Choice)
4.7/5 (29)
Filters
- Essay(0)
- Multiple Choice(0)
- Short Answer(0)
- True False(0)
- Matching(0)