Exam 10: Decision Models With Uncertainty and Risk
Exam 1: Data and Business Decisions93 Questions
Exam 2: Descriptive Statistics and Data Analysis99 Questions
Exam 3: Probability Concepts and Distributions111 Questions
Exam 4: Sampling and Estimation123 Questions
Exam 5: Hypothesis Testing and Statistical Inference99 Questions
Exam 6: Regression Analysis93 Questions
Exam 7: Forecasting100 Questions
Exam 8: Introduction to Statistical Quality Control101 Questions
Exam 9: Building and Using Decision Models74 Questions
Exam 10: Decision Models With Uncertainty and Risk90 Questions
Exam 11: Decisions, uncertainty, and Risk100 Questions
Exam 12: Queues and Process Simulation Modeling97 Questions
Exam 13: Linear Optimization98 Questions
Exam 14: Integer, nonlinear, and Advanced Optimization Methods100 Questions
Select questions type
The ________ feature in Crystal Ball allows an individual to determine the influence that each assumption has individually on a forecast.
(Multiple Choice)
4.8/5  (30)
(30)
Use the data shown below to answer the following question(s).
Captain Jack Automobiles launched a new car and tabulated the below data for the new launch.  The project manager identified the following distributions and parameters for these variables:
Market size: normal with a mean of 2,000,000 units and a standard deviation of 400,000 units
R&D costs: uniform between $639,000,000 and $781,000,000
Test Drives: lognormal with mean of $160,000,000 and standard deviation $16,000,000
Annual market growth factor: triangular with minimum = 2%,maximum = 6%,and most likely = 3%
Annual market share growth rate: triangular with minimum = 15%,maximum = 25%,and most likely = 20%
Use 5,000 trials to generate the simulation model using Crystal Ball.
-In the NPV forecast chart generated after running the simulation,you enter the number 0 in the right range box of the forecast chart and press the enter key.What exactly is the result of the above action?
The project manager identified the following distributions and parameters for these variables:
Market size: normal with a mean of 2,000,000 units and a standard deviation of 400,000 units
R&D costs: uniform between $639,000,000 and $781,000,000
Test Drives: lognormal with mean of $160,000,000 and standard deviation $16,000,000
Annual market growth factor: triangular with minimum = 2%,maximum = 6%,and most likely = 3%
Annual market share growth rate: triangular with minimum = 15%,maximum = 25%,and most likely = 20%
Use 5,000 trials to generate the simulation model using Crystal Ball.
-In the NPV forecast chart generated after running the simulation,you enter the number 0 in the right range box of the forecast chart and press the enter key.What exactly is the result of the above action?
(Multiple Choice)
4.9/5 (38)
The sensitivity chart displays the rankings of each assumption according to their impact on a forecast cell as a(n)________.
(Multiple Choice)
4.8/5 (34)
When compared to the forecast without correlated assumptions,the ________ of the forecast with correlated assumptions is ________,thus providing more accuracy in the estimate.
(Multiple Choice)
4.8/5 (33)
In a forecast chart provided by Crystal Ball,you intend to find the probability of a positive forecast value.In this scenario,you should ________.
(Multiple Choice)
4.8/5 (38)
Use the data shown below to answer the following question(s).
Captain Jack Automobiles launched a new car and tabulated the below data for the new launch. The project manager identified the following distributions and parameters for these variables:
Market size: normal with a mean of 2,000,000 units and a standard deviation of 400,000 units
R&D costs: uniform between $639,000,000 and $781,000,000
Test Drives: lognormal with mean of $160,000,000 and standard deviation $16,000,000
Annual market growth factor: triangular with minimum = 2%,maximum = 6%,and most likely = 3%
Annual market share growth rate: triangular with minimum = 15%,maximum = 25%,and most likely = 20%
Use 5,000 trials to generate the simulation model using Crystal Ball.
-For the given data set,what is the approximate percentage of risk that the NPV over the five years will not be positive?
(Multiple Choice)
4.8/5 (36)
In the ________ year,Captain Jack Automobiles is likely to realize a cumulative profit of approximately $(680,000,000)with a probability of at least 0.95.
(Multiple Choice)
4.9/5 (32)
Use the data shown below to answer the following question(s).
Captain Jack Automobiles launched a new car and tabulated the below data for the new launch. 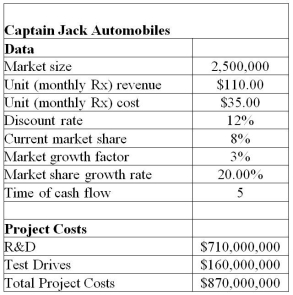 The project manager identified the following distributions and parameters for these variables:
Market size: normal with a mean of 2,000,000 units and a standard deviation of 400,000 units
R&D costs: uniform between $639,000,000 and $781,000,000
Test Drives: lognormal with mean of $160,000,000 and standard deviation $16,000,000
Annual market growth factor: triangular with minimum = 2%,maximum = 6%,and most likely = 3%
Annual market share growth rate: triangular with minimum = 15%,maximum = 25%,and most likely = 20%
Use 5,000 trails to generate the simulation model for NPV using Crystal Ball.
-Using the Tornado Chart tool,determine the assumption that has the least impact on the NPV.
The project manager identified the following distributions and parameters for these variables:
Market size: normal with a mean of 2,000,000 units and a standard deviation of 400,000 units
R&D costs: uniform between $639,000,000 and $781,000,000
Test Drives: lognormal with mean of $160,000,000 and standard deviation $16,000,000
Annual market growth factor: triangular with minimum = 2%,maximum = 6%,and most likely = 3%
Annual market share growth rate: triangular with minimum = 15%,maximum = 25%,and most likely = 20%
Use 5,000 trails to generate the simulation model for NPV using Crystal Ball.
-Using the Tornado Chart tool,determine the assumption that has the least impact on the NPV.
(Multiple Choice)
4.9/5 (37)
Assumption cells in Crystal Ball can be defined for formula,nonnumeric,or blank cells.
(True/False)
4.8/5 (36)
Filters
- Essay(0)
- Multiple Choice(0)
- Short Answer(0)
- True False(0)
- Matching(0)