Exam 12: Chi-Square Tests and Nonparametric Tests
Exam 1: Defining and Collecting Data189 Questions
Exam 3: Numerical Descriptive Measures184 Questions
Exam 4: Basic Probability156 Questions
Exam 5: Discrete Probability Distributions218 Questions
Exam 6: The Normal Distribution and Other Continuous Distributions189 Questions
Exam 7: Sampling Distributions127 Questions
Exam 8: Confidence Interval Estimation196 Questions
Exam 9: Fundamentals of Hypothesis Testing: One-Sample Tests170 Questions
Exam 10: Two-Sample Tests210 Questions
Exam 11: Analysis of Variance130 Questions
Exam 12: Chi-Square Tests and Nonparametric Tests175 Questions
Exam 13: Simple Linear Regression213 Questions
Exam 14: Introduction to Multiple Regression337 Questions
Exam 15: Multiple Regression Model Building96 Questions
Exam 16: Time-Series Forecasting165 Questions
Exam 17: A Roadmap for Analyzing Data303 Questions
Exam 18: Statistical Applications in Quality Management130 Questions
Exam 19: Decision Making126 Questions
Exam 20: Index Numbers44 Questions
Exam 21: Chi-Square Tests for the Variance or Standard Deviation11 Questions
Exam 22: Mcnemar Test for the Difference Between Two Proportions Related Samples15 Questions
Exam 25: The Analysis of Means Anom2 Questions
Exam 23: The Analysis of Proportions Anop3 Questions
Exam 24: The Randomized Block Design85 Questions
Exam 26: The Power of a Test41 Questions
Exam 27: Estimation and Sample Size Determination for Finite Populations13 Questions
Exam 28: Application of Confidence Interval Estimation in Auditing13 Questions
Exam 29: Sampling From Finite Populations20 Questions
Exam 30: The Normal Approximation to the Binomial Distribution27 Questions
Exam 31: Counting Rules14 Questions
Exam 32: Lets Get Started Big Things to Learn First33 Questions
Select questions type
TABLE 12-6
According to an article in Marketing News,fewer checks are being written at the grocery store checkout than in the past.To determine whether there is a difference in the proportion of shoppers who pay by check among three consecutive years at a 0.05 level of significance,the results of a survey of 500 shoppers in three consecutive years are obtained and presented below. 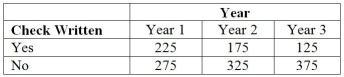 -Referring to Table 12-6,what is the expected number of shoppers who do not pay by check in year 3 if there is no difference in the proportion of shoppers who pay by check among the three years?
(Short Answer)
4.8/5  (34)
(34)
TABLE 12-6
According to an article in Marketing News,fewer checks are being written at the grocery store checkout than in the past.To determine whether there is a difference in the proportion of shoppers who pay by check among three consecutive years at a 0.05 level of significance,the results of a survey of 500 shoppers in three consecutive years are obtained and presented below.
-Referring to Table 12-6,what is the expected number of shoppers who pay by check in year 1 if there is no difference in the proportion of shoppers who pay by check among the three years?
(Short Answer)
4.9/5 (38)
TABLE 12-2
The dean of a college is interested in the proportion of graduates from his college who have a job offer on graduation day.He is particularly interested in seeing if there is a difference in this proportion for accounting and economics majors.In a random sample of 100 of each type of major at graduation,he found that 65 accounting majors and 52 economics majors had job offers.If the accounting majors are designated as "Group 1" and the economics majors are designated as "Group 2," perform the appropriate hypothesis test using a level of significance of 0.05.
-True or False: Referring to Table 12-2,the same decision would be made with this test if the level of significance had been 0.10 rather than 0.05.
(True/False)
4.8/5 (39)
TABLE 12-13
Recent studies have found that American children are more obese than in the past.The amount of time children spent watching television has received much of the blame.A survey of 100 ten-year-olds revealed the following with regards to weights and average number of hours a day spent watching television.We are interested in testing whether the mean number of hours spent watching TV and weights are independent at 1% level of significance. 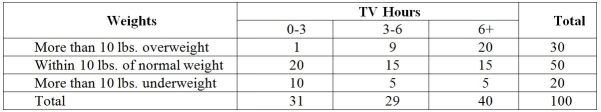 -Referring to Table 12-13,suppose the value of the test statistic was 30.00 (which is not the correct value)and the critical value at 1% level of significance was 10.00 (which is not the correct value),which of the following conclusions would be correct?
(Multiple Choice)
4.8/5 (36)
TABLE 12-1
A corporation randomly selects 150 salespeople and finds that 66% who have never taken a self-improvement course would like such a course.The firm did a similar study 10 years ago in which 60% of a random sample of 160 salespeople wanted a self-improvement course.The groups are assumed to be independent random samples.Let  and
and  represent the true proportion of workers who would like to attend a self-improvement course in the recent study and the past study,respectively.
-Referring to Table 12-1,what is the value of the test statistic to use in evaluating the alternative hypothesis that there is a difference in the two population proportions using α = 0.10?
represent the true proportion of workers who would like to attend a self-improvement course in the recent study and the past study,respectively.
-Referring to Table 12-1,what is the value of the test statistic to use in evaluating the alternative hypothesis that there is a difference in the two population proportions using α = 0.10?
(Multiple Choice)
4.8/5 (35)
TABLE 12-9
Many companies use well-known celebrities as spokespersons in their TV advertisements.A study was conducted to determine whether brand awareness of female TV viewers and the gender of the spokesperson are independent.Each in a sample of 300 female TV viewers was asked to identify a product advertised by a celebrity spokesperson.The gender of the spokesperson and whether or not the viewer could identify the product was recorded.The numbers in each category are given below. 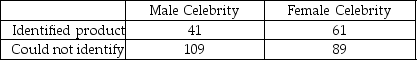 -Referring to Table 12-9,at 5% level of significance,the critical value of the test statistic is
(Multiple Choice)
4.9/5 (40)
TABLE 12-11
The director of admissions at a state college is interested in seeing if admissions status (admitted,waiting list,denied admission)at his college is independent of the type of community in which an applicant resides.He takes a sample of recent admissions decisions and forms the following table: 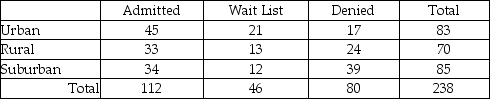 He will use this table to do a chi-square test of independence with a level of significance of 0.01.
-Referring to Table 12-11,the critical value of the test is ________.
He will use this table to do a chi-square test of independence with a level of significance of 0.01.
-Referring to Table 12-11,the critical value of the test is ________.
(Short Answer)
4.8/5 (35)
TABLE 12-13
Recent studies have found that American children are more obese than in the past.The amount of time children spent watching television has received much of the blame.A survey of 100 ten-year-olds revealed the following with regards to weights and average number of hours a day spent watching television.We are interested in testing whether the mean number of hours spent watching TV and weights are independent at 1% level of significance.
-Referring to Table 12-13,if there is no connection between weights and average number of hours spent watching TV,we should expect how many children to be spending 3-6 hours on average watching TV and are more than 10 lbs.underweight?
(Multiple Choice)
4.7/5 (39)
TABLE 12-5
Four surgical procedures currently are used to install pacemakers.If the patient does not need to return for follow-up surgery,the operation is called a "clear" operation.A heart center wants to compare the proportion of clear operations for the 4 procedures,and collects the following numbers of patients from their own records: 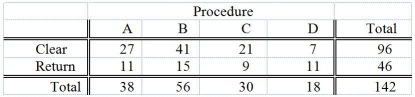 They will use this information to test for a difference among the proportion of clear operations using a chi-square test with a level of significance of 0.05.
-Referring to Table 12-5,what is the value of the critical range for the Marascuilo procedure to test for the difference in proportions between procedure A and procedure B using a 0.05 level of significance?
They will use this information to test for a difference among the proportion of clear operations using a chi-square test with a level of significance of 0.05.
-Referring to Table 12-5,what is the value of the critical range for the Marascuilo procedure to test for the difference in proportions between procedure A and procedure B using a 0.05 level of significance?
(Short Answer)
4.8/5 (36)
TABLE 12-9
Many companies use well-known celebrities as spokespersons in their TV advertisements.A study was conducted to determine whether brand awareness of female TV viewers and the gender of the spokesperson are independent.Each in a sample of 300 female TV viewers was asked to identify a product advertised by a celebrity spokesperson.The gender of the spokesperson and whether or not the viewer could identify the product was recorded.The numbers in each category are given below.
-Referring to Table 12-9,which test would be used to properly analyze the data in this experiment?
(Multiple Choice)
4.7/5 (35)
TABLE 12-14
A perfume manufacturer is trying to choose between 2 magazine advertising layouts.An expensive layout would include a small package of the perfume.A cheaper layout would include a "scratch-and-sniff" sample of the product.The manufacturer would use the more expensive layout only if there is evidence that it would lead to a higher approval rate.The manufacturer presents the more expensive layout to 4 groups and determines the approval rating for each group.He presents the "scratch-and-sniff" layout to 5 groups and again determines the approval rating of the perfume for each group.The data are given below.Use this to test the appropriate hypotheses with the Wilcoxon Rank Sum Test with a level of significance of 0.05. 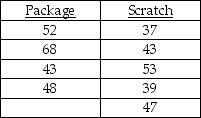 -Referring to Table 12-14,the critical value of the test is ________.
(Short Answer)
4.7/5 (35)
TABLE 12-17
Three new different models of compact SUVs have just arrived at the market.You are interested in comparing the gas mileage performance of all three models to see if they are the same.A partial computer output for twelve compact SUVs of each model is given below: 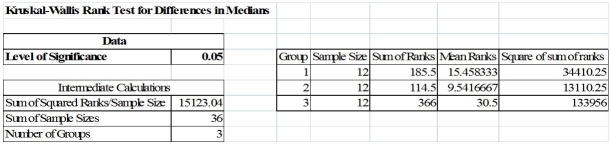 You are told that the gas mileage population distributions for all three models are not normally distributed.
-Referring to Table 12-17,what should be the null and alternative hypotheses of the test?
You are told that the gas mileage population distributions for all three models are not normally distributed.
-Referring to Table 12-17,what should be the null and alternative hypotheses of the test?
(Multiple Choice)
4.7/5 (37)
TABLE 12-6
According to an article in Marketing News,fewer checks are being written at the grocery store checkout than in the past.To determine whether there is a difference in the proportion of shoppers who pay by check among three consecutive years at a 0.05 level of significance,the results of a survey of 500 shoppers in three consecutive years are obtained and presented below.
-Referring to Table 12-6,what is the form of the alternative hypothesis?
(Multiple Choice)
4.8/5 (39)
TABLE 12-15
Two new different models of compact SUVs have just arrived at the market.You are interested in comparing the gas mileage performance of both models to see if they are the same.A partial computer output for twelve compact SUVs of model 1 and thirteen of model 2 is given below: 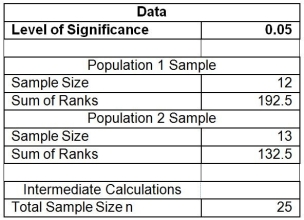 You are told that the gas mileage population distributions for both models are not normally distributed.
-The Journal of Business Venturing reported on the activities of entrepreneurs during the organization creation process.As part of a designed study,a total of 71 entrepreneurs were interviewed and divided into 3 groups: those that were successful in founding a new firm (n1 = 34),those still actively trying to establish a firm (n2 = 21),and those who tried to start a new firm but eventually gave up (n3 = 16).The total number of activities undertaken (e.g.,developed a business plan,sought funding,looked for facilities)by each group over a specified time period during organization creation was measured.The objective is to compare the mean number of activities of the 3 groups of entrepreneurs.Because of concerns over necessary assumption of the parametric analysis,it was decided to use a nonparametric analysis.Identify the nonparametric method that would be used to analyze the data.
You are told that the gas mileage population distributions for both models are not normally distributed.
-The Journal of Business Venturing reported on the activities of entrepreneurs during the organization creation process.As part of a designed study,a total of 71 entrepreneurs were interviewed and divided into 3 groups: those that were successful in founding a new firm (n1 = 34),those still actively trying to establish a firm (n2 = 21),and those who tried to start a new firm but eventually gave up (n3 = 16).The total number of activities undertaken (e.g.,developed a business plan,sought funding,looked for facilities)by each group over a specified time period during organization creation was measured.The objective is to compare the mean number of activities of the 3 groups of entrepreneurs.Because of concerns over necessary assumption of the parametric analysis,it was decided to use a nonparametric analysis.Identify the nonparametric method that would be used to analyze the data.
(Multiple Choice)
4.9/5 (34)
TABLE 12-9
Many companies use well-known celebrities as spokespersons in their TV advertisements.A study was conducted to determine whether brand awareness of female TV viewers and the gender of the spokesperson are independent.Each in a sample of 300 female TV viewers was asked to identify a product advertised by a celebrity spokesperson.The gender of the spokesperson and whether or not the viewer could identify the product was recorded.The numbers in each category are given below.
-Referring to Table 12-9,the calculated test statistic is
(Multiple Choice)
4.9/5 (37)
TABLE 12-13
Recent studies have found that American children are more obese than in the past.The amount of time children spent watching television has received much of the blame.A survey of 100 ten-year-olds revealed the following with regards to weights and average number of hours a day spent watching television.We are interested in testing whether the mean number of hours spent watching TV and weights are independent at 1% level of significance.
-Referring to Table 12-13,how many children in the survey spend no more than 6 hours watching TV and are more than 10 lbs.underweight?
(Multiple Choice)
4.9/5 (32)
TABLE 12-13
Recent studies have found that American children are more obese than in the past.The amount of time children spent watching television has received much of the blame.A survey of 100 ten-year-olds revealed the following with regards to weights and average number of hours a day spent watching television.We are interested in testing whether the mean number of hours spent watching TV and weights are independent at 1% level of significance.
-True or False: The procedure for the Wilcoxon rank sum test requires that you rank each group separately rather than together.
(True/False)
4.8/5 (29)
TABLE 12-7
Data on the percentage of 200 hotels in each of the three large cities across the world on whether minibar charges are correctly posted at checkout are given below. 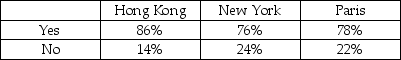 At the 0.05 level of significance,you want to know if there is evidence of a difference in the proportion of hotels that correctly post minibar charges among the three cities.
-True or False: Referring to Table 12-7,there is sufficient evidence to conclude that the proportions between New York and Paris are different at a 0.05 level of significance.
At the 0.05 level of significance,you want to know if there is evidence of a difference in the proportion of hotels that correctly post minibar charges among the three cities.
-True or False: Referring to Table 12-7,there is sufficient evidence to conclude that the proportions between New York and Paris are different at a 0.05 level of significance.
(True/False)
4.7/5 (32)
TABLE 12-15
Two new different models of compact SUVs have just arrived at the market.You are interested in comparing the gas mileage performance of both models to see if they are the same.A partial computer output for twelve compact SUVs of model 1 and thirteen of model 2 is given below: You are told that the gas mileage population distributions for both models are not normally distributed.
-Referring to Table 12-15,what is the mean of the Wilcoxon rank sum test statistic T1?
(Short Answer)
4.9/5 (33)
TABLE 12-15
Two new different models of compact SUVs have just arrived at the market.You are interested in comparing the gas mileage performance of both models to see if they are the same.A partial computer output for twelve compact SUVs of model 1 and thirteen of model 2 is given below: You are told that the gas mileage population distributions for both models are not normally distributed.
-Referring to Table 12-15,what is your conclusion on the test using a 5% level of significance?
(Multiple Choice)
4.9/5 (35)
Filters
- Essay(0)
- Multiple Choice(0)
- Short Answer(0)
- True False(0)
- Matching(0)