Exam 10: Two-Sample Tests
Exam 1: Defining and Collecting Data189 Questions
Exam 3: Numerical Descriptive Measures184 Questions
Exam 4: Basic Probability156 Questions
Exam 5: Discrete Probability Distributions218 Questions
Exam 6: The Normal Distribution and Other Continuous Distributions189 Questions
Exam 7: Sampling Distributions127 Questions
Exam 8: Confidence Interval Estimation196 Questions
Exam 9: Fundamentals of Hypothesis Testing: One-Sample Tests170 Questions
Exam 10: Two-Sample Tests210 Questions
Exam 11: Analysis of Variance130 Questions
Exam 12: Chi-Square Tests and Nonparametric Tests175 Questions
Exam 13: Simple Linear Regression213 Questions
Exam 14: Introduction to Multiple Regression337 Questions
Exam 15: Multiple Regression Model Building96 Questions
Exam 16: Time-Series Forecasting165 Questions
Exam 17: A Roadmap for Analyzing Data303 Questions
Exam 18: Statistical Applications in Quality Management130 Questions
Exam 19: Decision Making126 Questions
Exam 20: Index Numbers44 Questions
Exam 21: Chi-Square Tests for the Variance or Standard Deviation11 Questions
Exam 22: Mcnemar Test for the Difference Between Two Proportions Related Samples15 Questions
Exam 25: The Analysis of Means Anom2 Questions
Exam 23: The Analysis of Proportions Anop3 Questions
Exam 24: The Randomized Block Design85 Questions
Exam 26: The Power of a Test41 Questions
Exam 27: Estimation and Sample Size Determination for Finite Populations13 Questions
Exam 28: Application of Confidence Interval Estimation in Auditing13 Questions
Exam 29: Sampling From Finite Populations20 Questions
Exam 30: The Normal Approximation to the Binomial Distribution27 Questions
Exam 31: Counting Rules14 Questions
Exam 32: Lets Get Started Big Things to Learn First33 Questions
Select questions type
TABLE 10-4
Two samples each of size 25 are taken from independent populations assumed to be normally distributed with equal variances.The first sample has a mean of 35.5 and standard deviation of 3.0 while the second sample has a mean of 33.0 and standard deviation of 4.0.
-In testing for the differences between the means of two related populations,the ________ hypothesis is the hypothesis of "no differences."
(Short Answer)
5.0/5  (45)
(45)
TABLE 10-8
A few years ago,Pepsi invited consumers to take the "Pepsi Challenge." Consumers were asked to decide which of two sodas,Coke or Pepsi,they preferred in a blind taste test.Pepsi was interested in determining what factors played a role in people's taste preferences.One of the factors studied was the gender of the consumer.Below are the results of analyses comparing the taste preferences of men and women with the proportions depicting preference for Pepsi.
Males: n = 109,pM = 0.422018 Females: n = 52,pF = 0.25
pM - pF = 0.172018 Z = 2.11825
-Referring to Table 10-8,construct a 95% confidence interval estimate of the difference between the proportion of males and females who prefer Pepsi.
(Short Answer)
4.8/5 (33)
TABLE 10-5
To test the effectiveness of a business school preparation course,8 students took a general business test before and after the course.The results are given below. 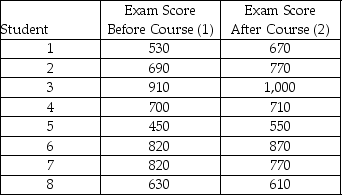 -Referring to Table 10-5,the calculated value of the test statistic is ________.
(Short Answer)
4.8/5 (34)
TABLE 10-13
The amount of time required to reach a customer service representative has a huge impact on customer satisfaction.Below is the Excel output from a study to see whether there is evidence of a difference in the mean amounts of time required to reach a customer service representative between two hotels.Assume that the population variances in the amount of time for the two hotels are not equal.  -Referring to Table 10-13,what is the largest level of significance at which a test on a difference in the variabilities of the amount of time required to reach a customer service representative between the two hotels will not be rejected?
(Essay)
4.9/5 (45)
TABLE 10-2
A researcher randomly sampled 30 graduates of an MBA program and recorded data concerning their starting salaries.Of primary interest to the researcher was the effect of gender on starting salaries.The result of the pooled-variance t-test of the mean salaries of the females (Population 1)and males (Population 2)in the sample is given below. 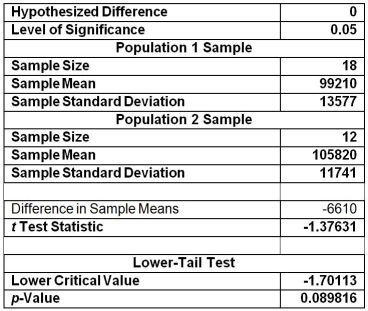 -Referring to Table 10-2,what is the 99% confidence interval estimate for the difference between two means?
(Short Answer)
4.7/5 (35)
TABLE 10-12
A quality control engineer is in charge of the manufacture of USB flash drives.Two different processes can be used to manufacture the flash drives.He suspects that the Kohler method produces a greater proportion of defects than the Russell method.He samples 150 of the Kohler and 200 of the Russell flash drives and finds that 27 and 18 of them,respectively,are defective.If Kohler is designated as "Group 1" and Russell is designated as "Group 2," perform the appropriate test at a level of significance of 0.01.
-True or False: Referring to Table 10-12,the same decision would be made with this test if the level of significance had been 0.05 rather than 0.01.
(True/False)
4.8/5 (42)
TABLE 10-4
Two samples each of size 25 are taken from independent populations assumed to be normally distributed with equal variances.The first sample has a mean of 35.5 and standard deviation of 3.0 while the second sample has a mean of 33.0 and standard deviation of 4.0.
-Referring to Table 10-4,the p-value for a two-tail test is ________.
(Essay)
4.9/5 (48)
TABLE 10-14
The use of preservatives by food processors has become a controversial issue.Suppose two preservatives are extensively tested and determined safe for use in meats.A processor wants to compare the preservatives for their effects on retarding spoilage.Suppose 15 cuts of fresh meat are treated with preservative I and 15 are treated with preservative II,and the number of hours until spoilage begins is recorded for each of the 30 cuts of meat.The results are summarized in the table below. 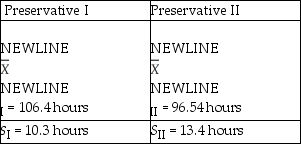 -Referring to Table 10-14,what is the critical value for testing if the population variances differ for preservatives I and II at the 5% level of significance?
(Essay)
4.9/5 (36)
TABLE 10-4
Two samples each of size 25 are taken from independent populations assumed to be normally distributed with equal variances.The first sample has a mean of 35.5 and standard deviation of 3.0 while the second sample has a mean of 33.0 and standard deviation of 4.0.
-Referring to Table 10-4,the p-value for a one-tail test (in the hypothesized direction)is ________.
(Essay)
4.9/5 (38)
TABLE 10-12
A quality control engineer is in charge of the manufacture of USB flash drives.Two different processes can be used to manufacture the flash drives.He suspects that the Kohler method produces a greater proportion of defects than the Russell method.He samples 150 of the Kohler and 200 of the Russell flash drives and finds that 27 and 18 of them,respectively,are defective.If Kohler is designated as "Group 1" and Russell is designated as "Group 2," perform the appropriate test at a level of significance of 0.01.
-Referring to Table 10-12,construct a 90% confidence interval estimate of the difference in proportion between the Kohler and Russell flash drives that are defective.
(Short Answer)
4.9/5 (39)
TABLE 10-11
The dean of a college is interested in the proportion of graduates from his college who have a job offer on graduation day.He is particularly interested in seeing if there is a difference in this proportion for accounting and economics majors.In a random sample of 100 of each type of major at graduation,he found that 65 accounting majors and 52 economics majors had job offers.If the accounting majors are designated as "Group 1" and the economics majors are designated as "Group 2," perform the appropriate hypothesis test using a level of significance of 0.05.
-True or False: Referring to Table 10-11,the same decision would be made with this test if the level of significance had been 0.10 rather than 0.05.
(True/False)
4.7/5 (38)
TABLE 10-5
To test the effectiveness of a business school preparation course,8 students took a general business test before and after the course.The results are given below.
-Referring to Table 10-5,the p-value of the test statistic is ________.
(Essay)
4.7/5 (44)
TABLE 10-5
To test the effectiveness of a business school preparation course,8 students took a general business test before and after the course.The results are given below.
-Referring to Table 10-5,the value of the standard error of the difference scores is
(Multiple Choice)
4.8/5 (38)
TABLE 10-14
The use of preservatives by food processors has become a controversial issue.Suppose two preservatives are extensively tested and determined safe for use in meats.A processor wants to compare the preservatives for their effects on retarding spoilage.Suppose 15 cuts of fresh meat are treated with preservative I and 15 are treated with preservative II,and the number of hours until spoilage begins is recorded for each of the 30 cuts of meat.The results are summarized in the table below.
-Referring to Table 10-14,suppose α = 0.05.Which of the following represents the result of the relevant hypothesis test?
(Multiple Choice)
4.9/5 (37)
TABLE 10-15
The table below presents the summary statistics for the starting annual salaries (in thousands of dollars)for individuals entering the public accounting and financial planning professions.
Sample I (public accounting):  1 = 60.35,S1 = 3.25,n1 = 12
Sample II (financial planning):
1 = 60.35,S1 = 3.25,n1 = 12
Sample II (financial planning):  2 = 58.20,S2 = 2.48,n2 = 14
Test whether the mean starting annual salaries for individuals entering the public accounting professions is higher than that of financial planning assuming that the two population variances are the same.
-Referring to Table 10-15,suppose α = 0.01.Which of the following represents the correct conclusion?
2 = 58.20,S2 = 2.48,n2 = 14
Test whether the mean starting annual salaries for individuals entering the public accounting professions is higher than that of financial planning assuming that the two population variances are the same.
-Referring to Table 10-15,suppose α = 0.01.Which of the following represents the correct conclusion?
(Multiple Choice)
4.9/5 (34)
TABLE 10-15
The table below presents the summary statistics for the starting annual salaries (in thousands of dollars)for individuals entering the public accounting and financial planning professions.
Sample I (public accounting): 1 = 60.35,S1 = 3.25,n1 = 12
Sample II (financial planning): 2 = 58.20,S2 = 2.48,n2 = 14
Test whether the mean starting annual salaries for individuals entering the public accounting professions is higher than that of financial planning assuming that the two population variances are the same.
-Referring to Table 10-15,suppose α = 0.10.Which of the following represents the correct conclusion?
(Multiple Choice)
4.8/5 (33)
TABLE 10-6
To investigate the efficacy of a diet,a random sample of 16 male patients is selected from a population of adult males using the diet.The weight of each individual in the sample is taken at the start of the diet and at a medical follow-up 4 weeks later.Assuming that the population of differences in weight before versus after the diet follow a normal distribution,the t-test for related samples can be used to determine if there was a significant decrease in the mean weight during this period.Suppose the mean decrease in weights over all 16 subjects in the study is 3.0 pounds with the standard deviation of differences computed as 6.0 pounds.
-Referring to Table 10-6,there are ________ degrees of freedom for this test.
(Short Answer)
4.7/5 (35)
TABLE 10-12
A quality control engineer is in charge of the manufacture of USB flash drives.Two different processes can be used to manufacture the flash drives.He suspects that the Kohler method produces a greater proportion of defects than the Russell method.He samples 150 of the Kohler and 200 of the Russell flash drives and finds that 27 and 18 of them,respectively,are defective.If Kohler is designated as "Group 1" and Russell is designated as "Group 2," perform the appropriate test at a level of significance of 0.01.
-True or False: The F test used for testing the difference in two population variances is always a one-tail test.
(True/False)
4.9/5 (38)
TABLE 10-12
A quality control engineer is in charge of the manufacture of USB flash drives.Two different processes can be used to manufacture the flash drives.He suspects that the Kohler method produces a greater proportion of defects than the Russell method.He samples 150 of the Kohler and 200 of the Russell flash drives and finds that 27 and 18 of them,respectively,are defective.If Kohler is designated as "Group 1" and Russell is designated as "Group 2," perform the appropriate test at a level of significance of 0.01.
-The statistical distribution used for testing the difference between two population variances is the ________ distribution.
(Multiple Choice)
4.9/5 (35)
TABLE 10-6
To investigate the efficacy of a diet,a random sample of 16 male patients is selected from a population of adult males using the diet.The weight of each individual in the sample is taken at the start of the diet and at a medical follow-up 4 weeks later.Assuming that the population of differences in weight before versus after the diet follow a normal distribution,the t-test for related samples can be used to determine if there was a significant decrease in the mean weight during this period.Suppose the mean decrease in weights over all 16 subjects in the study is 3.0 pounds with the standard deviation of differences computed as 6.0 pounds.
-Referring to Table 10-6,what is the 95% confidence interval estimate for the mean difference in weight before and after the diet?
(Short Answer)
4.8/5 (36)
Filters
- Essay(0)
- Multiple Choice(0)
- Short Answer(0)
- True False(0)
- Matching(0)