Exam 9: Fundamentals of Hypothesis Testing: One-Sample Tests
Exam 1: Defining and Collecting Data189 Questions
Exam 3: Numerical Descriptive Measures184 Questions
Exam 4: Basic Probability156 Questions
Exam 5: Discrete Probability Distributions218 Questions
Exam 6: The Normal Distribution and Other Continuous Distributions189 Questions
Exam 7: Sampling Distributions127 Questions
Exam 8: Confidence Interval Estimation196 Questions
Exam 9: Fundamentals of Hypothesis Testing: One-Sample Tests170 Questions
Exam 10: Two-Sample Tests210 Questions
Exam 11: Analysis of Variance130 Questions
Exam 12: Chi-Square Tests and Nonparametric Tests175 Questions
Exam 13: Simple Linear Regression213 Questions
Exam 14: Introduction to Multiple Regression337 Questions
Exam 15: Multiple Regression Model Building96 Questions
Exam 16: Time-Series Forecasting165 Questions
Exam 17: A Roadmap for Analyzing Data303 Questions
Exam 18: Statistical Applications in Quality Management130 Questions
Exam 19: Decision Making126 Questions
Exam 20: Index Numbers44 Questions
Exam 21: Chi-Square Tests for the Variance or Standard Deviation11 Questions
Exam 22: Mcnemar Test for the Difference Between Two Proportions Related Samples15 Questions
Exam 25: The Analysis of Means Anom2 Questions
Exam 23: The Analysis of Proportions Anop3 Questions
Exam 24: The Randomized Block Design85 Questions
Exam 26: The Power of a Test41 Questions
Exam 27: Estimation and Sample Size Determination for Finite Populations13 Questions
Exam 28: Application of Confidence Interval Estimation in Auditing13 Questions
Exam 29: Sampling From Finite Populations20 Questions
Exam 30: The Normal Approximation to the Binomial Distribution27 Questions
Exam 31: Counting Rules14 Questions
Exam 32: Lets Get Started Big Things to Learn First33 Questions
Select questions type
TABLE 9-7
A major home improvement store conducted its biggest brand recognition campaign in the company's history.A series of new television advertisements featuring well-known entertainers and sports figures were launched.A key metric for the success of television advertisements is the proportion of viewers who "like the ads a lot".A study of 1,189 adults who viewed the ads reported that 230 indicated that they "like the ads a lot." The percentage of a typical television advertisement receiving the "like the ads a lot" score is believed to be 22%.Company officials wanted to know if there is evidence that the series of television advertisements are less successful than the typical ad at a 0.01 level of significance.
-Referring to Table 9-7,the null hypothesis will be rejected if the test statistic is
(Multiple Choice)
4.8/5  (39)
(39)
TABLE 9-9
The president of a university claimed that the entering class this year appeared to be larger than the entering class from previous years but their mean SAT score is lower than previous years.He took a sample of 20 of this year's entering students and found that their mean SAT score is 1,501 with a standard deviation of 53.The university's record indicates that the mean SAT score for entering students from previous years is 1,520.He wants to find out if his claim is supported by the evidence at a 5% level of significance.
-True or False: Referring to Table 9-9,if these data were used to perform a two-tail test,the p-value would be 0.1254.
(True/False)
4.9/5 (36)
How many tissues should the Kimberly Clark Corporation package of Kleenex contain? Researchers determined that 60 tissues is the mean number of tissues used during a cold.Suppose a random sample of 100 Kleenex users yielded the following data on the number of tissues used during a cold:  = 52, S = 22.Give the null and alternative hypotheses to determine if the number of tissues used during a cold is less than 60.
(Multiple Choice)
4.7/5 (31)
How many tissues should the Kimberly Clark Corporation package of Kleenex contain? Researchers determined that 60 tissues is the mean number of tissues used during a cold.Suppose a random sample of 100 Kleenex users yielded the following data on the number of tissues used during a cold:  = 52, S = 22.Using the sample information provided,calculate the value of the test statistic.
(Multiple Choice)
4.7/5 (38)
TABLE 9-2
A student claims that he can correctly identify whether a person is a business major or an agriculture major by the way the person dresses.Suppose in actuality that if someone is a business major,he can correctly identify that person as a business major 87% of the time.When a person is an agriculture major,the student will incorrectly identify that person as a business major 16% of the time.Presented with one person and asked to identify the major of this person (who is either a business or an agriculture major),he considers this to be a hypothesis test with the null hypothesis being that the person is a business major and the alternative that the person is an agriculture major.
-Referring to Table 9-2,what is the power of the test?
(Multiple Choice)
4.9/5 (34)
Which of the following would be an appropriate alternative hypothesis?
(Multiple Choice)
4.9/5 (30)
TABLE 9-9
The president of a university claimed that the entering class this year appeared to be larger than the entering class from previous years but their mean SAT score is lower than previous years.He took a sample of 20 of this year's entering students and found that their mean SAT score is 1,501 with a standard deviation of 53.The university's record indicates that the mean SAT score for entering students from previous years is 1,520.He wants to find out if his claim is supported by the evidence at a 5% level of significance.
-Referring to Table 9-9,state the null hypothesis for this study.
(Short Answer)
4.9/5 (40)
A major Blu-ray rental chain is considering opening a new store in an area that currently does not have any such stores.The chain will open if there is evidence that more than 5,000 of the 20,000 households in the area are equipped with Blu-ray players.It conducts a telephone poll of 300 randomly selected households in the area and finds that 96 have Blu-ray players.The rental chain's conclusion from the hypothesis test using a 5% level of significance is
(Multiple Choice)
4.9/5 (39)
TABLE 9-6
The quality control engineer for a furniture manufacturer is interested in the mean amount of force necessary to produce cracks in stressed oak furniture.She performs a two-tail test of the null hypothesis that the mean for the stressed oak furniture is 650.The calculated value of the Z test statistic is a positive number that leads to a p-value of 0.080 for the test.
-True or False: Referring to Table 9-6,suppose the engineer had decided that the alternative hypothesis to test was that the mean was greater than 650.Then if the test is performed with a level of significance of 0.05,the null hypothesis would be rejected.
(True/False)
4.9/5 (39)
For a given level of significance (α),if the sample size n is increased,the probability of a Type II error (β)
(Multiple Choice)
4.7/5 (34)
The symbol for the probability of committing a Type II error of a statistical test is
(Multiple Choice)
4.8/5 (38)
TABLE 9-7
A major home improvement store conducted its biggest brand recognition campaign in the company's history.A series of new television advertisements featuring well-known entertainers and sports figures were launched.A key metric for the success of television advertisements is the proportion of viewers who "like the ads a lot".A study of 1,189 adults who viewed the ads reported that 230 indicated that they "like the ads a lot." The percentage of a typical television advertisement receiving the "like the ads a lot" score is believed to be 22%.Company officials wanted to know if there is evidence that the series of television advertisements are less successful than the typical ad at a 0.01 level of significance.
-Referring to Table 9-7,state the alternative hypothesis for this study.
(Short Answer)
4.8/5 (35)
TABLE 9-1
Microsoft Excel was used on a set of data involving the number of defective items found in a random sample of 46 cases of light bulbs produced during a morning shift at a plant.A manager wants to know if the mean number of defective bulbs per case is greater than 20 during the morning shift.She will make her decision using a test with a level of significance of 0.10.The following information was extracted from the Microsoft Excel output for the sample of 46 cases: 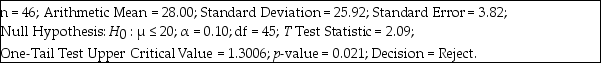 -True or False: Referring to Table 9-1,the manager can conclude that there is sufficient evidence to show that the mean number of defective bulbs per case is greater than 20 during the morning shift using a level of significance of 0.10.
(True/False)
4.7/5 (39)
A survey claims that 9 out of 10 doctors recommend aspirin for their patients with headaches.To test this claim against the alternative that the actual proportion of doctors who recommend aspirin is less than 0.90,a random sample of 100 doctors was selected.Suppose that the test statistic is -2.20.Can you conclude that H0 should be rejected at the (a)α = 0.10,(b)α = 0.05,and (c)α = 0.01 level of Type I error?
(Multiple Choice)
4.9/5 (39)
True or False: Referring to Table 9-1,the manager can conclude that there is sufficient evidence to show that the mean number of defective bulbs per case is greater than 20 during the morning shift with no more than a 1% probability of incorrectly rejecting the true null hypothesis.
(True/False)
4.8/5 (24)
TABLE 9-9
The president of a university claimed that the entering class this year appeared to be larger than the entering class from previous years but their mean SAT score is lower than previous years.He took a sample of 20 of this year's entering students and found that their mean SAT score is 1,501 with a standard deviation of 53.The university's record indicates that the mean SAT score for entering students from previous years is 1,520.He wants to find out if his claim is supported by the evidence at a 5% level of significance.
-True or False: Referring to Table 9-9,the president can conclude that the mean SAT score of the entering class this year is lower than previous years using a level of significance of 0.10.
(True/False)
4.8/5 (25)
An entrepreneur is considering the purchase of a coin-operated laundry.The current owner claims that over the past 5 years,the mean daily revenue was $675 with a population standard deviation of $75.A sample of 30 days reveals a daily mean revenue of $625.If you were to test the null hypothesis that the daily mean revenue was $675,which test would you use?
(Multiple Choice)
4.9/5 (37)
True or False: A proper methodology in performing hypothesis tests is to ask whether a random sample can be selected from the population of interest.
(True/False)
4.9/5 (32)
If a researcher rejects a false null hypothesis,she has made a(n)________ decision.
(Short Answer)
4.9/5 (39)
TABLE 9-6
The quality control engineer for a furniture manufacturer is interested in the mean amount of force necessary to produce cracks in stressed oak furniture.She performs a two-tail test of the null hypothesis that the mean for the stressed oak furniture is 650.The calculated value of the Z test statistic is a positive number that leads to a p-value of 0.080 for the test.
-Referring to Table 9-6,suppose the engineer had decided that the alternative hypothesis to test was that the mean was greater than 650.What would be the p-value of this one-tail test?
(Multiple Choice)
4.8/5 (35)
Filters
- Essay(0)
- Multiple Choice(0)
- Short Answer(0)
- True False(0)
- Matching(0)