Exam 3: Numerical Descriptive Measures
Exam 1: Defining and Collecting Data189 Questions
Exam 3: Numerical Descriptive Measures184 Questions
Exam 4: Basic Probability156 Questions
Exam 5: Discrete Probability Distributions218 Questions
Exam 6: The Normal Distribution and Other Continuous Distributions189 Questions
Exam 7: Sampling Distributions127 Questions
Exam 8: Confidence Interval Estimation196 Questions
Exam 9: Fundamentals of Hypothesis Testing: One-Sample Tests170 Questions
Exam 10: Two-Sample Tests210 Questions
Exam 11: Analysis of Variance130 Questions
Exam 12: Chi-Square Tests and Nonparametric Tests175 Questions
Exam 13: Simple Linear Regression213 Questions
Exam 14: Introduction to Multiple Regression337 Questions
Exam 15: Multiple Regression Model Building96 Questions
Exam 16: Time-Series Forecasting165 Questions
Exam 17: A Roadmap for Analyzing Data303 Questions
Exam 18: Statistical Applications in Quality Management130 Questions
Exam 19: Decision Making126 Questions
Exam 20: Index Numbers44 Questions
Exam 21: Chi-Square Tests for the Variance or Standard Deviation11 Questions
Exam 22: Mcnemar Test for the Difference Between Two Proportions Related Samples15 Questions
Exam 25: The Analysis of Means Anom2 Questions
Exam 23: The Analysis of Proportions Anop3 Questions
Exam 24: The Randomized Block Design85 Questions
Exam 26: The Power of a Test41 Questions
Exam 27: Estimation and Sample Size Determination for Finite Populations13 Questions
Exam 28: Application of Confidence Interval Estimation in Auditing13 Questions
Exam 29: Sampling From Finite Populations20 Questions
Exam 30: The Normal Approximation to the Binomial Distribution27 Questions
Exam 31: Counting Rules14 Questions
Exam 32: Lets Get Started Big Things to Learn First33 Questions
Select questions type
True or False: Apple Computer,Inc.collected information on the age of their customers.Suppose the youngest customer was 12 and the oldest was 72.To study the distribution of the age among its customers,it can use a percentage polygon.
(True/False)
4.9/5  (42)
(42)
According to the empirical rule,if the data form a "bell-shaped" normal distribution,________ percent of the observations will be contained within 1 standard deviation around the arithmetic mean.
(Multiple Choice)
4.8/5 (31)
TABLE 2-14
The table below contains the number of people who own a portable Blu-ray player in a sample of 600 broken down by gender. 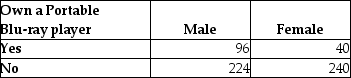 -Referring to Table 2-14,construct a table of total percentages.
(Essay)
4.9/5 (46)
TABLE 2-15
The figure below is the ogive for the amount of fat (in grams)for a sample of 36 pizza products where the upper boundaries of the intervals are: 5,10,15,20,25,and 30. 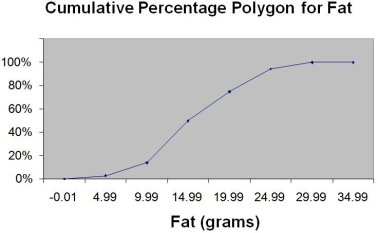 -Referring to Table 2-15,roughly what percentage of pizza products contains less than 10 grams of fat?
(Multiple Choice)
4.9/5 (30)
Filters
- Essay(0)
- Multiple Choice(0)
- Short Answer(0)
- True False(0)
- Matching(0)