Exam 2: Examining Data: Tables and Figures
Exam 1: Introduction to Statistics125 Questions
Exam 2: Examining Data: Tables and Figures125 Questions
Exam 3: Measures of Central Tendency119 Questions
Exam 4: Measures of Variability117 Questions
Exam 5: Normal Distributions127 Questions
Exam 6: Probability and Hypothesis Testing116 Questions
Exam 7: Testing One Sample Mean134 Questions
Exam 8: Estimating the Mean of a Population125 Questions
Exam 9: Testing the Difference Between Two Means132 Questions
Exam 10: Errors in Hypothesis Testing, Statistical Power, and Effect Size100 Questions
Exam 11: One-Way Analysis of Variance Anova117 Questions
Exam 12: Two-Way Analysis of Variance Anova131 Questions
Exam 13: Correlation120 Questions
Exam 14: Linear Regression and Multiple Correlation99 Questions
Exam 15: Chi-Square135 Questions
Select questions type
You would use a ______ to illustrate the data in this frequency distribution table because the variable is measured at the ______ level of measurement 
Free
(Multiple Choice)
4.8/5  (39)
(39)
Correct Answer: Verified
B
You would use a ______ to illustrate the data in this frequency distribution table because the variable is measured at the ______ level of measurement 
Free
(Multiple Choice)
4.7/5 (32)
Correct Answer:Verified
C
After grading an examination, an instructor realizes the exam was much easier than she planned. She reaches this conclusion because the shape of the distribution of exam scores is ______.
Free
(Multiple Choice)
4.7/5 (35)
Correct Answer:Verified
C
Filling in the blanks in this frequency distribution table, ______ of this sample had 'other' hair color; this represents ______ of the sample. 
(Multiple Choice)
4.9/5 (30)
A researcher asks a sample of people about their attitudes toward same-sex marriage and concludes that most people in her sample are strongly in favor of it, with relatively few people either undecided or against it. She reaches this conclusion because the shape of the distribution is ______.
(Multiple Choice)
4.8/5 (40)
Filling in the blanks in this frequency distribution table, the cumulative percent ('Cum %') associated with 3 victimization is ______. 
(Multiple Choice)
4.9/5 (30)
Which of the following BEST describes the shape of this distribution? 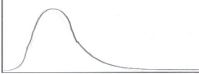
(Multiple Choice)
4.9/5 (27)
An instructor conducts a survey on the students to determine their religious preference. The data is measured at the ______ scale of measurement and therefore the instructor would use a ______ to illustrate the data.
(Multiple Choice)
4.8/5 (37)
Which of the following BEST describes the shape of the distribution? 4 13 18 4 6 2 4 6 4 8
(Multiple Choice)
4.9/5 (35)
You would use a ______ to illustrate the data in this frequency distribution table. 
(Multiple Choice)
4.7/5 (35)
Filling in the blanks in this frequency distribution table, the percentage ('%') for 2 arrests is ______; the cumulative percent ('Cum %') associated with 2 arrests is ______. 
(Multiple Choice)
4.7/5 (34)
In constructing figures such as bar charts and frequency polygons, the American Psychological Association recommends that ______.
(Multiple Choice)
4.8/5 (39)
-You would use a ______ to illustrate data for the variable "Number of cars per driver."
(Multiple Choice)
4.9/5 (24)
Filling in the blanks in this frequency distribution table, ______ of this sample are NOT employed; this represents ______ of the sample. 
(Multiple Choice)
4.9/5 (44)
Which of these is NOT one of the three aspects of distributions discussed in the textbook?
(Multiple Choice)
4.8/5 (31)
Which of the following BEST describes the shape of the distribution? 9, 2, 4, 6, 4, 7, 9, 4, 9, 11, 5
(Multiple Choice)
4.8/5 (28)
______ are rare, extreme scores that lie outside of the range of the majority of scores in a set of data.
(Multiple Choice)
4.8/5 (32)
A university surveys its students and finds the large majority of students are 'somewhat satisfied' with the education they have received, with only a few students either 'very unsatisfied' or 'very satisfied. Which of these BEST describes the distribution of salaries? 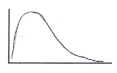 A
A 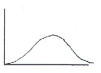 B
B 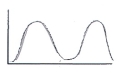 C
C 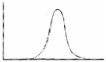 D
D
(Multiple Choice)
4.8/5 (32)
You would use the word ______ to describe the ______ of a distribution
(Multiple Choice)
4.8/5 (32)
Filters
- Essay(0)
- Multiple Choice(0)
- Short Answer(0)
- True False(0)
- Matching(0)