Exam 2: Examining Data: Tables and Figures
Exam 1: Introduction to Statistics125 Questions
Exam 2: Examining Data: Tables and Figures125 Questions
Exam 3: Measures of Central Tendency119 Questions
Exam 4: Measures of Variability117 Questions
Exam 5: Normal Distributions127 Questions
Exam 6: Probability and Hypothesis Testing116 Questions
Exam 7: Testing One Sample Mean134 Questions
Exam 8: Estimating the Mean of a Population125 Questions
Exam 9: Testing the Difference Between Two Means132 Questions
Exam 10: Errors in Hypothesis Testing, Statistical Power, and Effect Size100 Questions
Exam 11: One-Way Analysis of Variance Anova117 Questions
Exam 12: Two-Way Analysis of Variance Anova131 Questions
Exam 13: Correlation120 Questions
Exam 14: Linear Regression and Multiple Correlation99 Questions
Exam 15: Chi-Square135 Questions
Select questions type
Grouped frequency distribution tables are used for variables measured at the ordinal level of measurement.
(True/False)
4.8/5  (34)
(34)
Which of these is NOT a reason why researchers examine data they have collected?
(Multiple Choice)
4.8/5 (40)
Which of the following BEST describes the shape of this distribution? 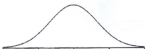
(Multiple Choice)
4.8/5 (32)
After grading an examination, an instructor realizes there is a wide range of ability among her students. She reaches this conclusion because the shape of the distribution is ______.
(Multiple Choice)
4.8/5 (24)
Which of the following is included in the APA guidelines for creating figures?
(Multiple Choice)
4.8/5 (23)
In constructing figures such as bar charts and frequency polygons, the American Psychological Association recommends that ______.
(Multiple Choice)
4.8/5 (33)
Filling in the blanks in this frequency distribution table, ______ of this sample took physics; on the other hand, ______took chemistry. 
(Multiple Choice)
4.8/5 (38)
Which of these is NOT one of the three aspects of distributions discussed in the textbook?
(Multiple Choice)
4.7/5 (41)
Which of the following is a reason why researchers examine the data they have collected?
(Multiple Choice)
4.8/5 (35)
A pollster finds that people are either strongly in favor of abortion or are strongly opposed. Which of these BEST describes the distribution of salaries? 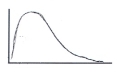 A
A 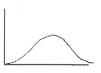 B
B 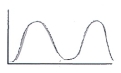 C
C 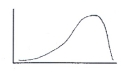 D
D
(Multiple Choice)
4.8/5 (23)
Which of the following BEST describes the shape of the distribution? 9, 4, 1, 6, 9, 8, 11, 9, 8, 9, 7
(Multiple Choice)
4.7/5 (26)
Which of these is NOT a reason why researchers examine data they have collected?
(Multiple Choice)
4.8/5 (37)
You would use a ______ to illustrate data for the variable "Number of siblings."
(Multiple Choice)
4.8/5 (41)
You would use a ______ to illustrate the data in this frequency distribution table because the variable is measured at the ______ level of measurement 
(Multiple Choice)
4.8/5 (31)
Which level of measurement of data would be BEST suited to construct a grouped frequency distribution?
(Multiple Choice)
4.9/5 (40)
Filling in the blanks in this frequency distribution table, ______ of this sample selected 'Lunch'; this represents ______ of the sample. 
(Multiple Choice)
4.8/5 (33)
You would use a ______ to illustrate the data in this frequency distribution table. 
(Multiple Choice)
4.9/5 (36)
Which of these is a reason why researchers examine data by creating tables and figures?
(Multiple Choice)
4.9/5 (38)
Filling in the blanks in this frequency distribution table, ______ of this sample work 0-10 hours per week; this represents ______ of the sample. 
(Multiple Choice)
4.9/5 (31)
Filling in the blanks in this frequency distribution table, the percentage ('%') for 2 arrests is ______; the cumulative percent ('Cum %') associated with 2 arrests is ______. 
(Multiple Choice)
4.9/5 (33)
Filters
- Essay(0)
- Multiple Choice(0)
- Short Answer(0)
- True False(0)
- Matching(0)