Exam 2: Examining Data: Tables and Figures
Exam 1: Introduction to Statistics125 Questions
Exam 2: Examining Data: Tables and Figures125 Questions
Exam 3: Measures of Central Tendency119 Questions
Exam 4: Measures of Variability117 Questions
Exam 5: Normal Distributions127 Questions
Exam 6: Probability and Hypothesis Testing116 Questions
Exam 7: Testing One Sample Mean134 Questions
Exam 8: Estimating the Mean of a Population125 Questions
Exam 9: Testing the Difference Between Two Means132 Questions
Exam 10: Errors in Hypothesis Testing, Statistical Power, and Effect Size100 Questions
Exam 11: One-Way Analysis of Variance Anova117 Questions
Exam 12: Two-Way Analysis of Variance Anova131 Questions
Exam 13: Correlation120 Questions
Exam 14: Linear Regression and Multiple Correlation99 Questions
Exam 15: Chi-Square135 Questions
Select questions type
You would use a ______ to illustrate the data in this frequency distribution table because the variable is measured at the ______ level of measurement 
(Multiple Choice)
4.7/5  (34)
(34)
Which of the following is TRUE statement regarding intervals in a grouped frequency distribution table?
(Multiple Choice)
4.9/5 (41)
Which of these is a reason why researchers examine data by creating tables and figures?
(Multiple Choice)
4.9/5 (39)
You would use the word ______ to describe the ______ of a distribution
(Multiple Choice)
4.8/5 (40)
Filling in the blanks in this frequency distribution table, ______ of the students had SAT Math scores between 200 and 400; this represents ______ of the class. 
(Multiple Choice)
4.7/5 (38)
For which of these variables would you create a grouped frequency distribution table to summarize data you've collected?
(Multiple Choice)
4.8/5 (33)
You would use a ______ to illustrate the data in this frequency distribution table because the variable is measured at the ______ level of measurement 
(Multiple Choice)
4.8/5 (35)
The smallest values of a variable that would be grouped into a particular interval are ______.
(Multiple Choice)
4.8/5 (23)
Filling in the blanks in this frequency distribution table, ______ of the students predicted Candidate C will win the election; this represents ______ of the sample. 
(Multiple Choice)
4.9/5 (32)
You would use a ______ to illustrate data for the 'Employment status' variable because it's measured at the ______ scale of measurement. 
(Multiple Choice)
4.8/5 (48)
A judge has been hired to resolve the salary negotiations between a company and its labor union. The great majority of union members have relatively low salaries; however, a small percentage of union members have very high salaries. Which of these BEST describes the distribution of salaries? 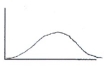 A
A 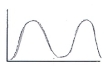 B
B 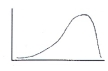 C
C 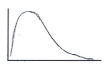 D
D
(Multiple Choice)
4.9/5 (34)
You would use the word ______ to describe the ______ of a distribution
(Multiple Choice)
4.8/5 (37)
Which of these is a reason why researchers examine data by creating tables and figures?
(Multiple Choice)
4.9/5 (30)
Filling in the blanks in this frequency distribution table, ______ of this sample had 0 jobs; this represents ______ of the sample. 
(Multiple Choice)
4.9/5 (36)
Filling in the blanks in this frequency distribution table, ______ of this sample had 1 job; on the other hand, ______had 2 jobs. 
(Multiple Choice)
4.9/5 (33)
You would use a ______ to illustrate the data in this frequency distribution table. 
(Multiple Choice)
4.9/5 (30)
You would use a ______ to illustrate data for a variable measured at the ______ scale of measurement.
(Multiple Choice)
4.8/5 (40)
Grouped frequency distribution tables group the values of a variable measured at the interval or ratio level of measurement into a small number of intervals.
(True/False)
4.9/5 (34)
Which of the following LEAST describes the shape of this distribution? 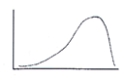
(Multiple Choice)
4.8/5 (40)
Filters
- Essay(0)
- Multiple Choice(0)
- Short Answer(0)
- True False(0)
- Matching(0)