Exam 2: Examining Data: Tables and Figures
Exam 1: Introduction to Statistics125 Questions
Exam 2: Examining Data: Tables and Figures125 Questions
Exam 3: Measures of Central Tendency119 Questions
Exam 4: Measures of Variability117 Questions
Exam 5: Normal Distributions127 Questions
Exam 6: Probability and Hypothesis Testing116 Questions
Exam 7: Testing One Sample Mean134 Questions
Exam 8: Estimating the Mean of a Population125 Questions
Exam 9: Testing the Difference Between Two Means132 Questions
Exam 10: Errors in Hypothesis Testing, Statistical Power, and Effect Size100 Questions
Exam 11: One-Way Analysis of Variance Anova117 Questions
Exam 12: Two-Way Analysis of Variance Anova131 Questions
Exam 13: Correlation120 Questions
Exam 14: Linear Regression and Multiple Correlation99 Questions
Exam 15: Chi-Square135 Questions
Select questions type
Filling in the blanks in this frequency distribution table, ______ of this sample preferred 'Yellow'; this represents ______ of the sample. 
(Multiple Choice)
4.8/5  (38)
(38)
Filling in the blanks in this frequency distribution table, ______ of this sample owned 1 phone; this represents ______ of the sample. 
(Multiple Choice)
4.8/5 (32)
Which of these is a reason why researchers examine the data they have collected?
(Multiple Choice)
4.9/5 (32)
Filling in the blanks in this frequency distribution table, ______ of this sample are 'NOT sure' of their plans after finishing college; this represents ______ of the sample. 
(Multiple Choice)
4.7/5 (31)
Filling in the blanks in this frequency distribution table, the cumulative percent ('Cum %') associated with a rating of 'Very good' is ______. 
(Multiple Choice)
4.9/5 (30)
When creating a grouped frequency distribution table, the number of intervals depends on ______.
(Multiple Choice)
4.8/5 (30)
Filling in the blanks in this frequency distribution table, ______ of this sample live in the 925 area code; this represents ______ of the sample. 
(Multiple Choice)
4.7/5 (33)
An instructor determines the number of students looking at Facebook or Twitter pages during five of her lectures. She would use a ______ to illustrate this data because this variable is measured at the ______ scale of measurement.
(Multiple Choice)
4.9/5 (28)
Filling in the blanks in this frequency distribution table, ______ of the sample are married; this represents ______ of the sample. 
(Multiple Choice)
4.9/5 (39)
A university asks students to indicate their level of satisfaction with their education (from low to high). They find the large majority of students are 'very satisfied' with their education, with relatively few students either 'very unsatisfied' or 'satisfied'. Which of these BEST describes this distribution? 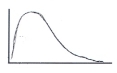 A
A 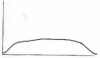 B
B 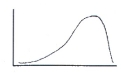 C
C 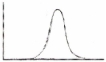 D
D
(Multiple Choice)
4.9/5 (42)
You would use a ______ to illustrate the data in this frequency distribution table. 
(Multiple Choice)
5.0/5 (31)
For the set of data below, pick the choice that BEST describes the shape of the distribution: 3, 7, 7, 12, 6, 7, 4, 7, 9, 7
(Multiple Choice)
4.8/5 (33)
You would use the word ______ in describing a distribution that is ______
(Multiple Choice)
4.9/5 (29)
When constructing a grouped frequency distribution table, you do NOT want many of the intervals to have a frequency (f) of zero.
(True/False)
4.9/5 (32)
Filling in the blanks in this frequency distribution table, the percentage ('%') for 10th grade is ______; the cumulative percent ('Cum %') associated with 10th grade is ______. 
(Multiple Choice)
4.9/5 (32)
A researcher asks a sample of people about their attitudes toward same-sex marriage and concludes people are either strongly in favor of it or strongly opposed, with relatively few people either unsure or indifferent. She reaches this conclusion because the shape of the distribution is ______.
(Multiple Choice)
4.9/5 (33)
After grading an examination, an instructor realizes the exam was much harder than he planned. He realizes this because the shape of the distribution of exam scores is ______.
(Multiple Choice)
4.8/5 (29)
The variability of a distribution refers to the amount of what in a distribution of data for a variable?
(Multiple Choice)
4.8/5 (40)
Filling in the blanks in this frequency distribution table, the cumulative percent ('Cum %') associated with a score of 31-40 is ______. 
(Multiple Choice)
4.8/5 (34)
The intervals created for a grouped frequency distribution table should represent the nature of the data as ______ as possible.
(Multiple Choice)
4.9/5 (36)
Filters
- Essay(0)
- Multiple Choice(0)
- Short Answer(0)
- True False(0)
- Matching(0)