Exam 12: B: Aggregate Demand and Aggregate Supply
Exam 1: B: Limits, Alternatives, and Choices265 Questions
Exam 1: A: - Limits, Alternatives, and Choices60 Questions
Exam 2: B: The Market System and the Circular Flow119 Questions
Exam 2: A: - The Market System and the Circular Flow42 Questions
Exam 3: B: Demand, Supply, and Market Equilibrium291 Questions
Exam 3: A: - Demand, Supply, and Market Equilibrium51 Questions
Exam 4: B: Market Failures: Public Goods and Externalities133 Questions
Exam 4: A: - Market Failures: Public Goods and Externalities36 Questions
Exam 5: B: Governments Role and Government Failure121 Questions
Exam 5: A: Governments Role and Government Failure1 Questions
Exam 6: B: an Introduction to Macroeconomics65 Questions
Exam 6: A: an Introduction to Macroeconomics31 Questions
Exam 7: B: Measuring the Economys Output191 Questions
Exam 7: A: Measuring the Economys Output30 Questions
Exam 8: B: Economic Growth122 Questions
Exam 8: A: Economic Growth35 Questions
Exam 9: B: Business Cycles, Unemployment, and Inflation193 Questions
Exam 9: A: Business Cycles, Unemployment, and Inflation40 Questions
Exam 10: B: Basic Macroeconomic Relationships200 Questions
Exam 10: A: Basic Macroeconomic Relationships26 Questions
Exam 11: B: The Aggregate Expenditures Model238 Questions
Exam 11: A: The Aggregate Expenditures Model47 Questions
Exam 12: B: Aggregate Demand and Aggregate Supply203 Questions
Exam 12: A: Aggregate Demand and Aggregate Supply35 Questions
Exam 13: B: Fiscal Policy, Deficits, Surpluses, and Debt234 Questions
Exam 13: A: Fiscal Policy, Deficits, Surpluses, and Debt53 Questions
Exam 14: B: Money, Banking, and Money Creation206 Questions
Exam 14: A: Money, Banking, and Money Creation56 Questions
Exam 15: B: Interest Rates and Monetary Policy239 Questions
Exam 15: A: Interest Rates and Monetary Policy47 Questions
Exam 17: C: Financial Economics323 Questions
Exam 16: A: Long-Run Macroeconomic Adjustments28 Questions
Exam 16: B: Long-Run Macroeconomic Adjustments122 Questions
Exam 17: A: International Trade40 Questions
Exam 17: B: International Trade188 Questions
Exam 18: A: The Balance of Payments and Exchange Rates30 Questions
Exam 18: B: The Balance of Payments and Exchange Rates133 Questions
Exam 22: The Economics of Developing Countries254 Questions
Select questions type
In the short run, the aggregate supply curve of an economy is:
(Multiple Choice)
4.7/5  (29)
(29)
Refer to the information below.A change in net export spending would most likely be caused by changes in: The following list of factors is related to the aggregate demand curve.Real-balances effect
Household expectations
Interest-rate effect
Personal income tax rates
Profit expectations
National income abroad
Government spending
Foreign trade effect
Exchange rates
Degree of excess capacity
(Multiple Choice)
4.9/5 (30)
An economy is employing 2 units of capital, 5 units of raw materials, and 8 units of labour to produce its total output of 640 units.Each unit of capital costs $10, each unit of raw materials, $4, and each unit of labour, $3.Refer to the above information.As a result of the change indicated in the previous question, the aggregate:
(Multiple Choice)
4.9/5 (31)
Suppose that real domestic output in an economy is 20 units, the quantity of inputs is 10, and the price of each input is $4.The per unit cost of production in the economy described above is:
(Multiple Choice)
4.9/5 (34)
Refer to the diagram below.Other things equal, a shift of the aggregate supply curve from AS0 to AS1 might be caused by a(n): 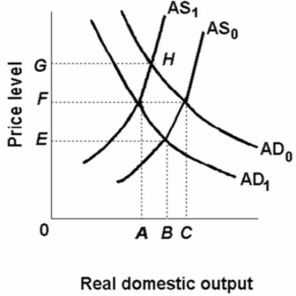
(Multiple Choice)
4.9/5 (38)
An increase in government spending can be expected to shift the:
(Multiple Choice)
4.8/5 (34)
The following aggregate demand and aggregate supply schedules are for a hypothetical economy.  Refer to the data above.The vertical range of the aggregate supply curve is associated with price levels:
(Multiple Choice)
4.9/5 (34)
A movement downward along an existing aggregate demand curve is equivalent to a(n):
(Multiple Choice)
4.9/5 (29)
Refer to the diagram given below. 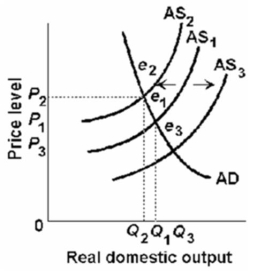 If aggregate supply shifts from AS1 to AS2, then the price level will:
(Multiple Choice)
4.8/5 (30)
Refer to the table below that shows the data of a country.  The table given above is for a particular country in which C is consumption expenditures, Ig is gross investment expenditures, G is government expenditures, X is exports, and M is imports.All the figures are in billions of dollars.If the country's aggregate supply curve is a vertical line at the $25 billion level of real GDP, the price level will be:
(Multiple Choice)
4.8/5 (30)
 If real output rises and the price level falls, this would likely be due to a:
(Multiple Choice)
4.7/5 (36)
The economy experiences a decrease in the price level and an increase in real domestic output.Which is a likely explanation?
(Multiple Choice)
4.9/5 (23)
Other things equal, a reduction in personal and business taxes can be expected to:
(Multiple Choice)
4.8/5 (32)
Which would be considered to be one of the factors that shift the aggregate supply curve? A change in:
(Multiple Choice)
4.8/5 (44)
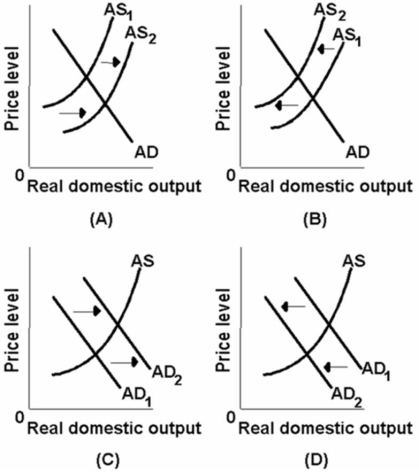 Which of the above diagrams best portrays the effects of a decrease in the availability of key natural resources?
(Multiple Choice)
4.9/5 (39)
The passage of new legislation requiring more extensive government regulation of business will most likely:
(Multiple Choice)
4.7/5 (25)
Filters
- Essay(0)
- Multiple Choice(0)
- Short Answer(0)
- True False(0)
- Matching(0)