Exam 12: B: Aggregate Demand and Aggregate Supply
Exam 1: B: Limits, Alternatives, and Choices265 Questions
Exam 1: A: - Limits, Alternatives, and Choices60 Questions
Exam 2: B: The Market System and the Circular Flow119 Questions
Exam 2: A: - The Market System and the Circular Flow42 Questions
Exam 3: B: Demand, Supply, and Market Equilibrium291 Questions
Exam 3: A: - Demand, Supply, and Market Equilibrium51 Questions
Exam 4: B: Market Failures: Public Goods and Externalities133 Questions
Exam 4: A: - Market Failures: Public Goods and Externalities36 Questions
Exam 5: B: Governments Role and Government Failure121 Questions
Exam 5: A: Governments Role and Government Failure1 Questions
Exam 6: B: an Introduction to Macroeconomics65 Questions
Exam 6: A: an Introduction to Macroeconomics31 Questions
Exam 7: B: Measuring the Economys Output191 Questions
Exam 7: A: Measuring the Economys Output30 Questions
Exam 8: B: Economic Growth122 Questions
Exam 8: A: Economic Growth35 Questions
Exam 9: B: Business Cycles, Unemployment, and Inflation193 Questions
Exam 9: A: Business Cycles, Unemployment, and Inflation40 Questions
Exam 10: B: Basic Macroeconomic Relationships200 Questions
Exam 10: A: Basic Macroeconomic Relationships26 Questions
Exam 11: B: The Aggregate Expenditures Model238 Questions
Exam 11: A: The Aggregate Expenditures Model47 Questions
Exam 12: B: Aggregate Demand and Aggregate Supply203 Questions
Exam 12: A: Aggregate Demand and Aggregate Supply35 Questions
Exam 13: B: Fiscal Policy, Deficits, Surpluses, and Debt234 Questions
Exam 13: A: Fiscal Policy, Deficits, Surpluses, and Debt53 Questions
Exam 14: B: Money, Banking, and Money Creation206 Questions
Exam 14: A: Money, Banking, and Money Creation56 Questions
Exam 15: B: Interest Rates and Monetary Policy239 Questions
Exam 15: A: Interest Rates and Monetary Policy47 Questions
Exam 17: C: Financial Economics323 Questions
Exam 16: A: Long-Run Macroeconomic Adjustments28 Questions
Exam 16: B: Long-Run Macroeconomic Adjustments122 Questions
Exam 17: A: International Trade40 Questions
Exam 17: B: International Trade188 Questions
Exam 18: A: The Balance of Payments and Exchange Rates30 Questions
Exam 18: B: The Balance of Payments and Exchange Rates133 Questions
Exam 22: The Economics of Developing Countries254 Questions
Select questions type
We would expect a decline in personal and corporate income taxes to:
(Multiple Choice)
4.9/5  (31)
(31)
The following table gives information about the relationship between input quantities and real domestic output in a hypothetical economy:  Suppose that the price of each input increased from $5 to $8.The per unit cost of production in the above economy would:
(Multiple Choice)
4.8/5 (28)
The following table is for a particular country in which C is consumption expenditures, Ig is gross investment expenditures, G is government expenditures, X is exports, and M is imports.All figures are in billions of dollars.Each question is independent of the other questions.  Refer to the above table.If the equilibrium level of real GDP is $43 billion in this country, its level of consumption will be:
(Multiple Choice)
4.8/5 (34)
Which of the factors below best explain the downward slope of aggregate demand curve? The following list of factors, are related to the aggregate demand curve.Real-balances effect
Household expectations
Interest-rate effect
Personal income tax rates
Profit expectations
National income abroad
Government spending
Foreign trade effect
Exchange rates
Degree of excess capacity
(Multiple Choice)
4.9/5 (35)
The factors which affect the amounts that consumers, businesses, government, and foreigners wish to purchase at each price level are the:
(Multiple Choice)
4.8/5 (30)
A change in business taxes and regulation can affect input prices and aggregate supply.
(True/False)
4.8/5 (31)
In terms of aggregate supply, the short run is a period in which:
(Multiple Choice)
4.8/5 (36)
The foreign trade effect suggests that a decrease in the Canadian price level relative to other countries will:
(Multiple Choice)
4.9/5 (27)
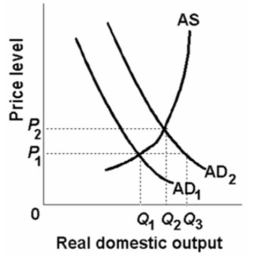 Refer to the above diagram.If the equilibrium price level is P1, then:
(Multiple Choice)
4.8/5 (37)
The interest-rate and real-balances effects are important because they help explain:
(Multiple Choice)
4.8/5 (32)
Refer to the diagram given below. 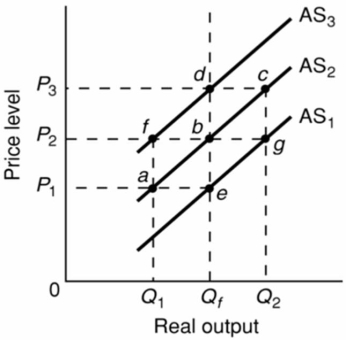 Assume that the nominal wages of workers are initially set on the basis of the price level P2 and that the economy is initially operating at the full-employment level of output Qf.In the short run, demand-pull inflation could best be shown as:
(Multiple Choice)
5.0/5 (38)
Refer to the diagram below. 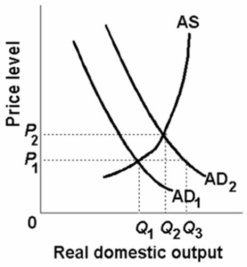 Which of the following would shift the aggregate demand curve from AD2 to AD1?
(Multiple Choice)
5.0/5 (31)
Refer to the diagram below. 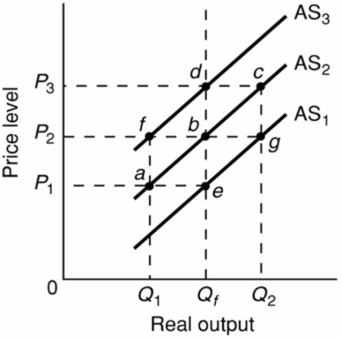 Assume that the nominal wages of workers in an economy are initially set on the basis of the price level P2 and that the economy initially is operating at the full-employment level of output Qf.In the short run, cost-push inflation could best be shown by a:
(Multiple Choice)
4.8/5 (32)
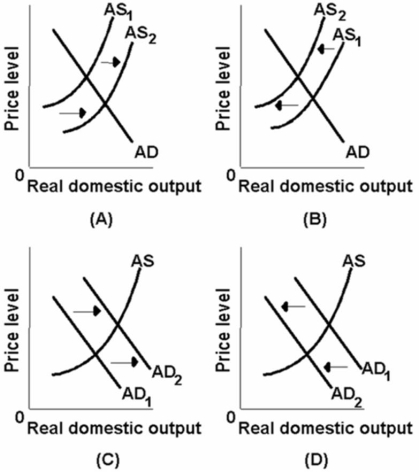 Which of the above diagrams best portrays the effects of a dramatic increase in energy prices?
(Multiple Choice)
4.8/5 (30)
Shifts in the aggregate supply curve are caused by changes in:
(Multiple Choice)
4.9/5 (33)
An increase in investment spending can be expected to shift the:
(Multiple Choice)
4.9/5 (28)
In which of the following sets of circumstances can we confidently expect inflation?
(Multiple Choice)
4.7/5 (38)
Refer to the figure given below. 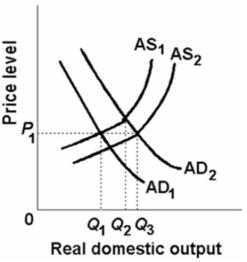 In the above figure, AD1 and AS1 represent the original aggregate demand and aggregate supply curves, respectively.AD2 and AS2 show the new aggregate demand and aggregate supply curves.At the original equilibrium price and quantity, this economy is experiencing:
(Multiple Choice)
4.9/5 (34)
Filters
- Essay(0)
- Multiple Choice(0)
- Short Answer(0)
- True False(0)
- Matching(0)