Exam 12: B: Aggregate Demand and Aggregate Supply
Exam 1: B: Limits, Alternatives, and Choices265 Questions
Exam 1: A: - Limits, Alternatives, and Choices60 Questions
Exam 2: B: The Market System and the Circular Flow119 Questions
Exam 2: A: - The Market System and the Circular Flow42 Questions
Exam 3: B: Demand, Supply, and Market Equilibrium291 Questions
Exam 3: A: - Demand, Supply, and Market Equilibrium51 Questions
Exam 4: B: Market Failures: Public Goods and Externalities133 Questions
Exam 4: A: - Market Failures: Public Goods and Externalities36 Questions
Exam 5: B: Governments Role and Government Failure121 Questions
Exam 5: A: Governments Role and Government Failure1 Questions
Exam 6: B: an Introduction to Macroeconomics65 Questions
Exam 6: A: an Introduction to Macroeconomics31 Questions
Exam 7: B: Measuring the Economys Output191 Questions
Exam 7: A: Measuring the Economys Output30 Questions
Exam 8: B: Economic Growth122 Questions
Exam 8: A: Economic Growth35 Questions
Exam 9: B: Business Cycles, Unemployment, and Inflation193 Questions
Exam 9: A: Business Cycles, Unemployment, and Inflation40 Questions
Exam 10: B: Basic Macroeconomic Relationships200 Questions
Exam 10: A: Basic Macroeconomic Relationships26 Questions
Exam 11: B: The Aggregate Expenditures Model238 Questions
Exam 11: A: The Aggregate Expenditures Model47 Questions
Exam 12: B: Aggregate Demand and Aggregate Supply203 Questions
Exam 12: A: Aggregate Demand and Aggregate Supply35 Questions
Exam 13: B: Fiscal Policy, Deficits, Surpluses, and Debt234 Questions
Exam 13: A: Fiscal Policy, Deficits, Surpluses, and Debt53 Questions
Exam 14: B: Money, Banking, and Money Creation206 Questions
Exam 14: A: Money, Banking, and Money Creation56 Questions
Exam 15: B: Interest Rates and Monetary Policy239 Questions
Exam 15: A: Interest Rates and Monetary Policy47 Questions
Exam 17: C: Financial Economics323 Questions
Exam 16: A: Long-Run Macroeconomic Adjustments28 Questions
Exam 16: B: Long-Run Macroeconomic Adjustments122 Questions
Exam 17: A: International Trade40 Questions
Exam 17: B: International Trade188 Questions
Exam 18: A: The Balance of Payments and Exchange Rates30 Questions
Exam 18: B: The Balance of Payments and Exchange Rates133 Questions
Exam 22: The Economics of Developing Countries254 Questions
Select questions type
Refer to the diagram given below. 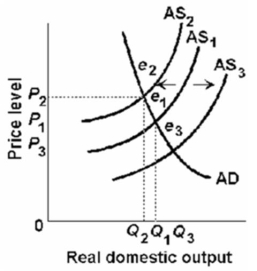 Cost-push inflation can be illustrated by a:
(Multiple Choice)
4.7/5  (39)
(39)
Refer to the diagram below.If the initial aggregate demand and supply curves are AD0 and AS0, the equilibrium price level and level of real domestic output will be: 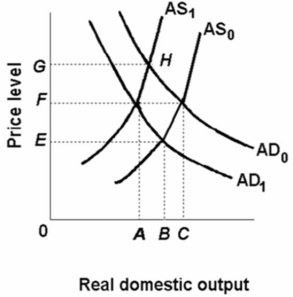
(Multiple Choice)
4.9/5 (28)
The aggregate expenditures model and the aggregate demand curve can be reconciled because, other things equal, in the aggregate expenditures model:
(Multiple Choice)
4.8/5 (39)
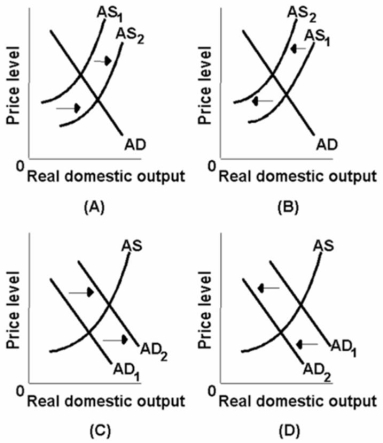 Which of the above diagrams best portrays the effects of declines in the incomes of other major nations with whom we trade?
(Multiple Choice)
4.8/5 (24)
Collective bargaining agreements that prohibit wage cuts for the duration of the contract contribute to:
(Multiple Choice)
4.8/5 (35)
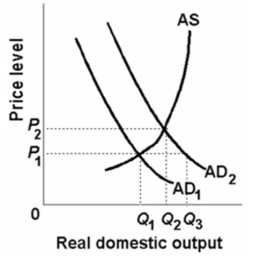 Refer to the above diagram.At the equilibrium price and quantity:
(Multiple Choice)
4.9/5 (36)
The aggregate demand curve can be derived from the aggregate expenditures model as indicated by the fact that:
(Multiple Choice)
4.7/5 (35)
Other things being equal, the higher the price level, the lower the level of domestic output purchased.This occurs because of:
(Multiple Choice)
5.0/5 (43)
Suppose higher taxes on businesses cause a decrease in spending on plant and equipment.How will this affect the aggregate expenditure (AE) and the aggregate demand (AD) schedules?
(Multiple Choice)
4.9/5 (34)
The following aggregate demand and supply schedules are for a hypothetical economy:  Refer to the above data.If the price level is 150 and producers supply $300 of real output:
(Multiple Choice)
4.9/5 (36)
Other things equal, if world oil prices increased by 70 percent then the most likely effect would be to:
(Multiple Choice)
4.8/5 (31)
Other things equal, an increase in productivity will shift the aggregate supply curve rightward.
(True/False)
4.8/5 (39)
Income and substitution effects what portions, if any, of aggregate supply and/or aggregate demand?
(Multiple Choice)
4.8/5 (27)
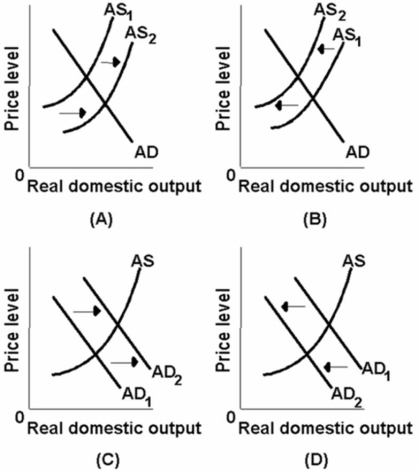 Which of the above diagrams best portrays the effects of declines in the prices of imported resources?
(Multiple Choice)
4.9/5 (34)
An increase in aggregate expenditures resulting from a decrease in the price level is equivalent to a:
(Multiple Choice)
4.9/5 (24)
Filters
- Essay(0)
- Multiple Choice(0)
- Short Answer(0)
- True False(0)
- Matching(0)