Exam 12: Part B: Aggregate Demand and Aggregate Supply
Exam 1: Part A: Limits, Alternatives, and Choices60 Questions
Exam 1: Part B: Limits, Alternatives, and Choices265 Questions
Exam 2: Part A: The Market System and the Circular Flow42 Questions
Exam 2: Part B: The Market System and the Circular Flow119 Questions
Exam 3: Part A: Demand, Supply, and Market Equilibrium51 Questions
Exam 3: Part B: Demand, Supply, and Market Equilibrium291 Questions
Exam 4: Part A: Market Failures: Public Goods and Externalities36 Questions
Exam 4: Part B: Market Failures: Public Goods and Externalities133 Questions
Exam 5: Part A: Governments Role and Government Failure1 Questions
Exam 5: Part B: Governments Role and Government Failure121 Questions
Exam 6: Part A: An Introduction to Macroeconomics31 Questions
Exam 6: Part B: An Introduction to Macroeconomics65 Questions
Exam 7: Part A: Measuring the Economys Output30 Questions
Exam 7: Part B: Measuring the Economys Output191 Questions
Exam 8: Part A: Economic Growth35 Questions
Exam 8: Part B: Economic Growth122 Questions
Exam 9: Part A: Business Cycles, Unemployment, and Inflation40 Questions
Exam 9: Part B: Business Cycles, Unemployment, and Inflation193 Questions
Exam 10: Part A: Basic Macroeconomic Relationships26 Questions
Exam 10: Part B: Basic Macroeconomic Relationships200 Questions
Exam 11: Part A: The Aggregate Expenditures Model47 Questions
Exam 11: Part B: The Aggregate Expenditures Model238 Questions
Exam 12: Part A: Aggregate Demand and Aggregate Supply35 Questions
Exam 12: Part B: Aggregate Demand and Aggregate Supply203 Questions
Exam 13: Part A: Fiscal Policy, Deficits, Surpluses, and Debt53 Questions
Exam 13: Part B: Fiscal Policy, Deficits, Surpluses, and Debt234 Questions
Exam 14: Part A: Money, Banking, and Money Creation56 Questions
Exam 14: Part B: Money, Banking, and Money Creation206 Questions
Exam 15: Part A: Interest Rates and Monetary Policy47 Questions
Exam 15: Part B: Interest Rates and Monetary Policy239 Questions
Exam 16: Part A: Long-Run Macroeconomic Adjustments28 Questions
Exam 16: Part B: Long-Run Macroeconomic Adjustments122 Questions
Exam 17: Part A: International Trade40 Questions
Exam 17: Part B: International Trade188 Questions
Exam 17: Part C: Financial Economics323 Questions
Exam 18: Part A: The Balance of Payments and Exchange Rates133 Questions
Exam 18: Part B: The Balance of Payments and Exchange Rates30 Questions
Exam 19: The Economics of Developing Countries254 Questions
Select questions type
Depreciation of the dollar relative to foreign currencies will tend to increase net exports and aggregate demand.
(True/False)
4.8/5  (46)
(46)
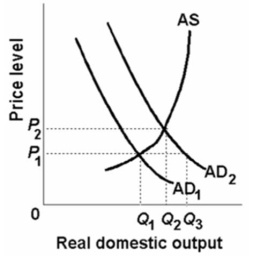 Refer to the above diagram.If equilibrium real output is Q2, then:
(Multiple Choice)
4.7/5 (45)
Which of the diagrams below best portrays the effects of an increase in consumer spending? 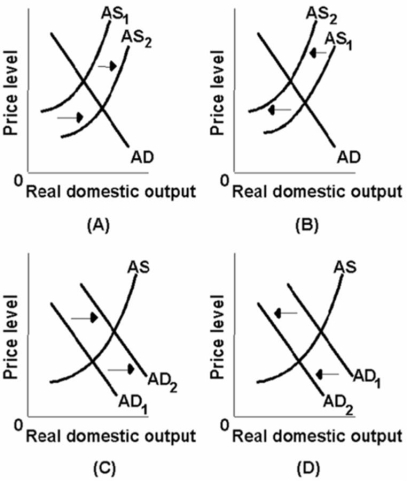
(Multiple Choice)
4.9/5 (30)
If personal taxes were decreased and input productivity increased simultaneously, the equilibrium:
(Multiple Choice)
4.8/5 (38)
 Refer to the above diagram.At the equilibrium price and quantity:
(Multiple Choice)
4.8/5 (42)
A decrease in per unit production costs will shift the aggregate supply curve leftward.
(True/False)
4.9/5 (39)
Refer to the diagram given below.  Assume that the nominal wages of workers in an economy are initially set on the basis of the price level P2 and that the economy is initially operating at the full-employment level of output Qf.In the long run, an increase in the price level from P2 to P3 will:
(Multiple Choice)
4.9/5 (38)
Refer to the diagram given below. 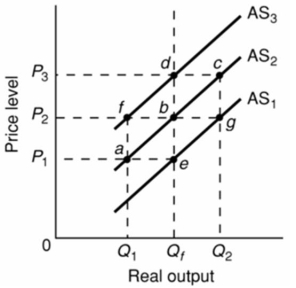 Assume that the nominal wages of workers in an economy are initially set on the basis of the price level P2 and that the economy initially is operating at the full-employment level of output Qf.In the diagram, the long-run aggregate supply curve:
(Multiple Choice)
4.8/5 (40)
The interest-rate effect causes the aggregate demand curve for an economy to:
(Multiple Choice)
4.9/5 (37)
The economy experiences an increase in the price level and a decrease in real domestic output.Which is a likely explanation?
(Multiple Choice)
4.8/5 (30)
Other things being equal, if the national incomes of our major international lending partners were to rise, our:
(Multiple Choice)
4.8/5 (37)
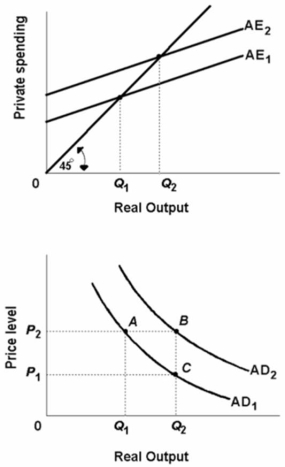 Refer to the above diagrams.A decline in aggregate expenditures from AE2 to AE1resulting from the wealth, interest rate, and foreign trade effects would be depicted as:
(Multiple Choice)
4.8/5 (42)
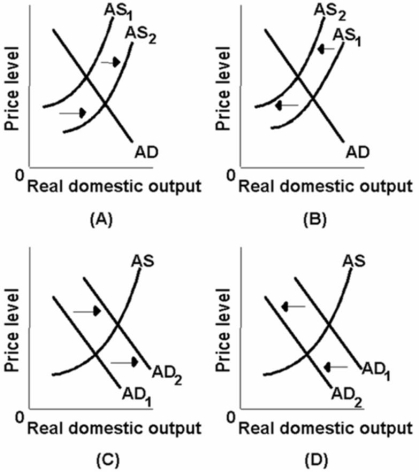 Which of the above diagrams best portrays the effects of a dramatic increase in energy prices?
(Multiple Choice)
4.9/5 (39)
A decrease in the price level in the aggregate expenditures model would:
(Multiple Choice)
4.8/5 (37)
The following table shows the aggregate demand and aggregate supply schedule for a hypothetical economy.  Refer to the above table.The equilibrium price level and quantity of real domestic output will be:
(Multiple Choice)
4.9/5 (35)
Which of the following would not shift the aggregate supply curve?
(Multiple Choice)
4.9/5 (36)
An increase in government spending can be expected to shift the:
(Multiple Choice)
4.7/5 (46)
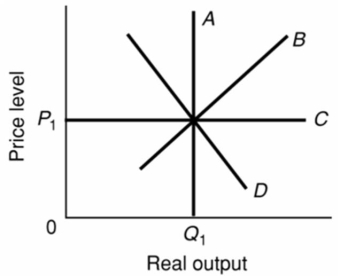 Refer to the above diagram.If the price level rises above P1 because of an increase in aggregate demand, the:
(Multiple Choice)
4.9/5 (34)
Filters
- Essay(0)
- Multiple Choice(0)
- Short Answer(0)
- True False(0)
- Matching(0)