Exam 12: Part B: Aggregate Demand and Aggregate Supply
Exam 1: Part A: Limits, Alternatives, and Choices60 Questions
Exam 1: Part B: Limits, Alternatives, and Choices265 Questions
Exam 2: Part A: The Market System and the Circular Flow42 Questions
Exam 2: Part B: The Market System and the Circular Flow119 Questions
Exam 3: Part A: Demand, Supply, and Market Equilibrium51 Questions
Exam 3: Part B: Demand, Supply, and Market Equilibrium291 Questions
Exam 4: Part A: Market Failures: Public Goods and Externalities36 Questions
Exam 4: Part B: Market Failures: Public Goods and Externalities133 Questions
Exam 5: Part A: Governments Role and Government Failure1 Questions
Exam 5: Part B: Governments Role and Government Failure121 Questions
Exam 6: Part A: An Introduction to Macroeconomics31 Questions
Exam 6: Part B: An Introduction to Macroeconomics65 Questions
Exam 7: Part A: Measuring the Economys Output30 Questions
Exam 7: Part B: Measuring the Economys Output191 Questions
Exam 8: Part A: Economic Growth35 Questions
Exam 8: Part B: Economic Growth122 Questions
Exam 9: Part A: Business Cycles, Unemployment, and Inflation40 Questions
Exam 9: Part B: Business Cycles, Unemployment, and Inflation193 Questions
Exam 10: Part A: Basic Macroeconomic Relationships26 Questions
Exam 10: Part B: Basic Macroeconomic Relationships200 Questions
Exam 11: Part A: The Aggregate Expenditures Model47 Questions
Exam 11: Part B: The Aggregate Expenditures Model238 Questions
Exam 12: Part A: Aggregate Demand and Aggregate Supply35 Questions
Exam 12: Part B: Aggregate Demand and Aggregate Supply203 Questions
Exam 13: Part A: Fiscal Policy, Deficits, Surpluses, and Debt53 Questions
Exam 13: Part B: Fiscal Policy, Deficits, Surpluses, and Debt234 Questions
Exam 14: Part A: Money, Banking, and Money Creation56 Questions
Exam 14: Part B: Money, Banking, and Money Creation206 Questions
Exam 15: Part A: Interest Rates and Monetary Policy47 Questions
Exam 15: Part B: Interest Rates and Monetary Policy239 Questions
Exam 16: Part A: Long-Run Macroeconomic Adjustments28 Questions
Exam 16: Part B: Long-Run Macroeconomic Adjustments122 Questions
Exam 17: Part A: International Trade40 Questions
Exam 17: Part B: International Trade188 Questions
Exam 17: Part C: Financial Economics323 Questions
Exam 18: Part A: The Balance of Payments and Exchange Rates133 Questions
Exam 18: Part B: The Balance of Payments and Exchange Rates30 Questions
Exam 19: The Economics of Developing Countries254 Questions
Select questions type
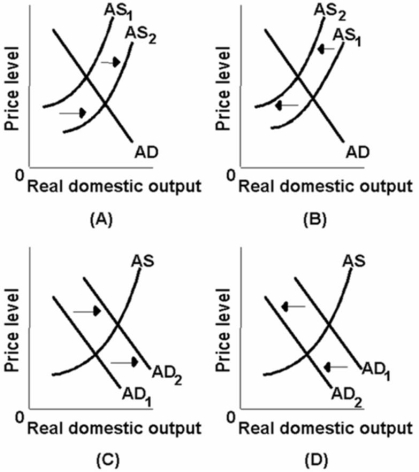 Which of the above diagrams best portrays the effects of declines in the prices of imported resources?
(Multiple Choice)
4.9/5  (37)
(37)
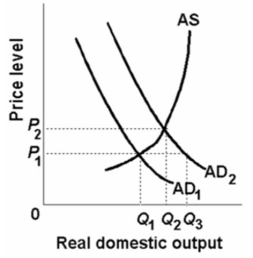 Refer to the above diagram.If the equilibrium price level is P1, then:
(Multiple Choice)
4.8/5 (35)
Suppose the full-employment level of real output (Q) for a hypothetical economy is $500 and that the price level (P) initially is 100.Use the following short-run aggregate supply schedules to answer the next question.  Refer to the information above.In the long run, an increase in the price level from 100 to 125 will:
(Multiple Choice)
4.8/5 (39)
Other things equal, the short-run aggregate supply curve shifts positions when:
(Multiple Choice)
4.9/5 (41)
Which of the following is true of aggregate supply in the long run?
(Multiple Choice)
4.8/5 (34)
An increase in the price level in the aggregate expenditures model would:
(Multiple Choice)
5.0/5 (42)
The following list of items are related to aggregate demand and/or aggregate supply.Entrepreneurial ability Consumer expectations
Degree of excess capacity
Personal income tax rates
Productivity
National income abroad
Business taxes
Domestic resource availability
Business taxes
Domestic resource availability
Prices of imported products
Profit expectations on investments
Refer to the above list.A change in which factor is most likely to change both aggregate demand and aggregate supply?
(Multiple Choice)
4.7/5 (44)
An increase in aggregate expenditures resulting from some factor other than a change in the price level is equivalent to:
(Multiple Choice)
4.9/5 (33)
With output and input prices fixed, the immediate short run aggregate supply curve is:
(Multiple Choice)
4.8/5 (44)
Which of the factors below best explain the downward slope of aggregate demand curve? The following list of factors, are related to the aggregate demand curve.Real-balances effect
Household expectations
Interest-rate effect
Personal income tax rates
Profit expectations
National income abroad
Government spending
Foreign trade effect
Exchange rates
Degree of excess capacity
(Multiple Choice)
4.7/5 (38)
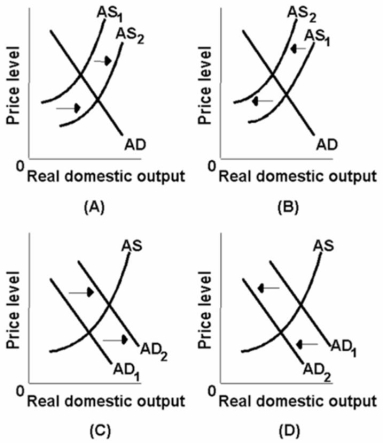 Which of the above diagrams best portrays the effects of an increase in foreign spending on our products?
(Multiple Choice)
4.8/5 (29)
A decrease in interest rates caused by a change in the price level would cause a(n):
(Multiple Choice)
4.7/5 (49)
A change in business taxes and regulation can affect input prices and aggregate supply.
(True/False)
4.7/5 (33)
Refer to the figure given below. 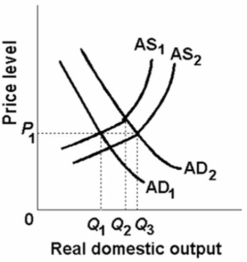 In the above figure, AD1 and AS1 represent the original aggregate demand and aggregate supply curves, respectively.AD2 and AS2 show the new aggregate demand and aggregate supply curves.At the original equilibrium price and quantity, this economy is experiencing:
(Multiple Choice)
4.8/5 (42)
A decrease in aggregate demand is most likely to be caused by:
(Multiple Choice)
4.8/5 (38)
 Which of the above diagrams best portrays the effects of a substantial reduction in government spending?
(Multiple Choice)
4.9/5 (37)
In terms of aggregate supply, the short run is a period in which:
(Multiple Choice)
4.9/5 (39)
The following table gives information about the relationship between input quantities and real domestic output in a hypothetical economy:  Suppose that the price of each input increased from $5 to $8.The per unit cost of production in the above economy would:
(Multiple Choice)
4.8/5 (35)
Filters
- Essay(0)
- Multiple Choice(0)
- Short Answer(0)
- True False(0)
- Matching(0)