Exam 12: Part B: Aggregate Demand and Aggregate Supply
Exam 1: Part A: Limits, Alternatives, and Choices60 Questions
Exam 1: Part B: Limits, Alternatives, and Choices265 Questions
Exam 2: Part A: The Market System and the Circular Flow42 Questions
Exam 2: Part B: The Market System and the Circular Flow119 Questions
Exam 3: Part A: Demand, Supply, and Market Equilibrium51 Questions
Exam 3: Part B: Demand, Supply, and Market Equilibrium291 Questions
Exam 4: Part A: Market Failures: Public Goods and Externalities36 Questions
Exam 4: Part B: Market Failures: Public Goods and Externalities133 Questions
Exam 5: Part A: Governments Role and Government Failure1 Questions
Exam 5: Part B: Governments Role and Government Failure121 Questions
Exam 6: Part A: An Introduction to Macroeconomics31 Questions
Exam 6: Part B: An Introduction to Macroeconomics65 Questions
Exam 7: Part A: Measuring the Economys Output30 Questions
Exam 7: Part B: Measuring the Economys Output191 Questions
Exam 8: Part A: Economic Growth35 Questions
Exam 8: Part B: Economic Growth122 Questions
Exam 9: Part A: Business Cycles, Unemployment, and Inflation40 Questions
Exam 9: Part B: Business Cycles, Unemployment, and Inflation193 Questions
Exam 10: Part A: Basic Macroeconomic Relationships26 Questions
Exam 10: Part B: Basic Macroeconomic Relationships200 Questions
Exam 11: Part A: The Aggregate Expenditures Model47 Questions
Exam 11: Part B: The Aggregate Expenditures Model238 Questions
Exam 12: Part A: Aggregate Demand and Aggregate Supply35 Questions
Exam 12: Part B: Aggregate Demand and Aggregate Supply203 Questions
Exam 13: Part A: Fiscal Policy, Deficits, Surpluses, and Debt53 Questions
Exam 13: Part B: Fiscal Policy, Deficits, Surpluses, and Debt234 Questions
Exam 14: Part A: Money, Banking, and Money Creation56 Questions
Exam 14: Part B: Money, Banking, and Money Creation206 Questions
Exam 15: Part A: Interest Rates and Monetary Policy47 Questions
Exam 15: Part B: Interest Rates and Monetary Policy239 Questions
Exam 16: Part A: Long-Run Macroeconomic Adjustments28 Questions
Exam 16: Part B: Long-Run Macroeconomic Adjustments122 Questions
Exam 17: Part A: International Trade40 Questions
Exam 17: Part B: International Trade188 Questions
Exam 17: Part C: Financial Economics323 Questions
Exam 18: Part A: The Balance of Payments and Exchange Rates133 Questions
Exam 18: Part B: The Balance of Payments and Exchange Rates30 Questions
Exam 19: The Economics of Developing Countries254 Questions
Select questions type
Refer to the diagram given below. 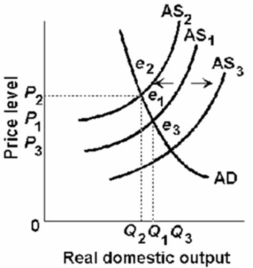 When the real output increases from Q1 and the price level decreases from P1, there should have been a:
(Multiple Choice)
4.9/5  (39)
(39)
A rightward shift in the aggregate supply curve might best be explained by:
(Multiple Choice)
4.7/5 (28)
Refer to the diagram below.If the initial aggregate demand and supply curves are AD0 and AS0, the equilibrium price level and level of real domestic output will be: 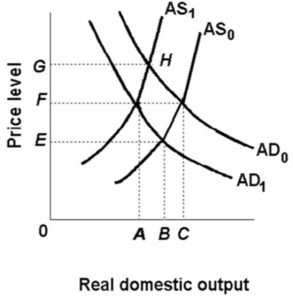
(Multiple Choice)
4.9/5 (34)
Other things equal, an increase in productivity will shift the aggregate supply curve rightward.
(True/False)
4.7/5 (40)
 If real output rises and the price level falls, this would likely be due to a:
(Multiple Choice)
4.8/5 (52)
A movement upward along an existing aggregate demand curve that changes the price level is equivalent to a(n):
(Multiple Choice)
4.9/5 (41)
The foreign-trade effect causes the aggregate demand curve for an economy to:
(Multiple Choice)
4.9/5 (28)
The passage of new legislation requiring more extensive government regulation of business will most likely:
(Multiple Choice)
4.9/5 (32)
The foreign trade effect suggests that a decrease in the Canadian price level relative to other countries will:
(Multiple Choice)
4.9/5 (42)
The aggregate demand curve can be derived from the aggregate expenditures model as indicated by the fact that:
(Multiple Choice)
4.8/5 (42)
Wage contracts, efficiency wages, and the minimum wage are explanations for why:
(Multiple Choice)
4.9/5 (41)
In which of the following sets of circumstances can we confidently expect inflation?
(Multiple Choice)
4.9/5 (42)
Other things equal, if the international value of the dollar were to depreciate, the:
(Multiple Choice)
4.9/5 (42)
The relationship between the aggregate demand curve and the aggregate expenditures model is shown in the fact that:
(Multiple Choice)
4.8/5 (35)
All else equal, an increase in imports will shift the aggregate expenditures curve:
(Multiple Choice)
4.9/5 (27)
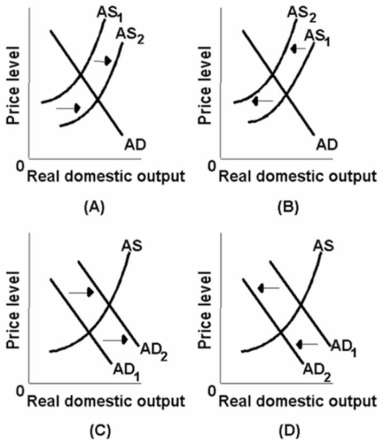 Which of the above diagrams best portrays the effects of declines in the incomes of other major nations with whom we trade?
(Multiple Choice)
4.8/5 (32)
The following table gives information about the relationship between input quantities and real domestic output in a hypothetical economy:  If the price of each input is $5, the per unit cost of production in the above economy is:
(Multiple Choice)
4.9/5 (40)
Filters
- Essay(0)
- Multiple Choice(0)
- Short Answer(0)
- True False(0)
- Matching(0)