Exam 3: Correlation and Prediction
Exam 1: Displaying the Order in a Group of Numbers Using Tables and Graphs72 Questions
Exam 2: The Mean, Variance, Standard Deviation, and Z Scores84 Questions
Exam 3: Correlation and Prediction96 Questions
Exam 4: Some Key Ingredients for Inferential Statistics: the Normal Curve, Sample Versus Population, and Probability71 Questions
Exam 5: Introduction to Hypothesis Testing99 Questions
Exam 6: Hypothesis Tests With Means of Samples77 Questions
Exam 7: Making Sense of Statistical Significance: Effect Size and Statistical Power73 Questions
Exam 8: Introduction to the T Test: Single Sample and Dependent Means115 Questions
Exam 9: The T Test for Independent Means85 Questions
Exam 10: Introduction to the Analysis of Variance131 Questions
Exam 11: Chi-Square Tests and Strategies When Population Distributions Are Not Normal124 Questions
Exam 12: Applying Statistical Methods in Your Own Research Project52 Questions
Select questions type
When high scores go with high scores, and low with low, the correlation coefficient will be between _________ and __________.
Free
(Short Answer)
4.9/5  (43)
(43)
Correct Answer: Verified
0, 1
Provide two reasons why it is important to identify the pattern of correlation in a scatter diagram before proceeding to figure the linear correlation.
Free
(Essay)
4.9/5 (41)
Correct Answer:Verified
Identifying whether the pattern of correlation is linear tells you whether it is appropriate to use the standard procedures for calculating a linear correlation.
If the pattern is linear, identifying the direction and approximate strength of correlation before doing the figuring provides a check of the results you derive from the actual calculations.
What is the difference between a positive correlation and a negative correlation?
Free
(Multiple Choice)
4.8/5 (38)
Correct Answer:Verified
B
A health researcher conducts a survey of the relation of proportion of fat in a person's diet to proportion of time the person uses a seat belt. (The idea is that those who practice one kind of health-related behavior may be more likely to practice another kind.)Here are the scores for three participants.
 M = 36.67 SD = 10.27 M = 53.33 SD = 12.47 r = -.96
a. Give the Z score prediction formula for predicting seat belt usage from fat in their diet.
b. Predict the seat belt usage of a person who has 40% fat in their diet.
c. Explain what you have done to a person who is familiar with correlation but not with regression.
M = 36.67 SD = 10.27 M = 53.33 SD = 12.47 r = -.96
a. Give the Z score prediction formula for predicting seat belt usage from fat in their diet.
b. Predict the seat belt usage of a person who has 40% fat in their diet.
c. Explain what you have done to a person who is familiar with correlation but not with regression.
(Essay)
4.8/5 (37)
In a particular industry it is known that the standardized regression coefficient for predicting likely profit from number of advertisements is .7. A company is planning to place 18 advertisements. Which of the following pieces of information will be needed as part of predicting the actual amount of profit?
(Multiple Choice)
4.9/5 (39)
A research article reports that a score is statistically significant. This means that it is unlikely that a correlation this high would have been observed in the group studied if the correlation were in fact zero for __________.
(Short Answer)
4.9/5 (39)
Which of the following is a way for researchers to rule out alternative directions of causality?
(Multiple Choice)
4.8/5 (35)
A research article reports a significant correlation using the .01 significance level. How would this be presented in the article if the correlation coefficient was .43?
(Multiple Choice)
4.8/5 (29)
In the social sciences, a strategy to rule out at least one direction of causality is to conduct studies where people are measured:
(Multiple Choice)
4.7/5 (35)
Which of the alternatives best describes the pattern of scores on the scatter diagram below? 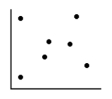
(Multiple Choice)
4.8/5 (41)
A study finds that the scarier the movie a person is watching, the more popcorn the person will eat. This relation between scariness of movies and popcorn is an example of a(n)__________ correlation.
(Short Answer)
5.0/5 (31)
Which of the following represents the strongest linear correlation?
(Multiple Choice)
4.9/5 (35)
In prediction with one predictor variable, the optimal number to use for beta (the standardized regression coefficient)is the:
(Multiple Choice)
4.7/5 (36)
A scatter diagram shows a pattern of dots in which the dots generally go down and to the right. This pattern is an example of a(n)__________ correlation.
(Short Answer)
4.9/5 (32)
A researcher surveys a group of working married women and reports the following results for the first four surveyed:
 M = 45 SD = 11.18 M = 82.5 SD = 10.9 r = -.92
a. Give the Z score prediction formula for predicting proportion of housework done from proportion of income contributed.
b. Predict the contribution to housework for a woman who provides 90% of the income.
c. Explain what you have done to a person who is familiar with correlation but not with regression.
M = 45 SD = 11.18 M = 82.5 SD = 10.9 r = -.92
a. Give the Z score prediction formula for predicting proportion of housework done from proportion of income contributed.
b. Predict the contribution to housework for a woman who provides 90% of the income.
c. Explain what you have done to a person who is familiar with correlation but not with regression.
(Essay)
4.7/5 (36)
Suppose that you want to be able to predict college grades from information about high school grades. In this case, the college grades would be called the:
(Multiple Choice)
4.9/5 (37)
A scatter diagram shows a pattern of dots in which the dots generally go up and to the right. This pattern is an example of a(n)__________ correlation.
(Short Answer)
4.8/5 (34)
When calculating a correlation coefficient, why is it important to divide the sum of cross-products of Z scores by the number of people in the study?
(Essay)
4.8/5 (27)
Suppose that you would like to predict a person's college GPA from the person's SAT score. In this situation, the SAT score is called the:
(Multiple Choice)
4.8/5 (41)
Which of the alternatives best describes the pattern of scores graphed below? 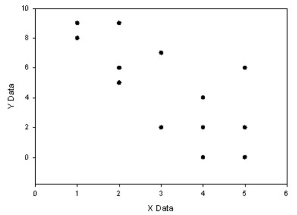
(Multiple Choice)
4.7/5 (36)
Filters
- Essay(0)
- Multiple Choice(0)
- Short Answer(0)
- True False(0)
- Matching(0)