Exam 3: Correlation and Prediction
Exam 1: Displaying the Order in a Group of Numbers Using Tables and Graphs72 Questions
Exam 2: The Mean, Variance, Standard Deviation, and Z Scores84 Questions
Exam 3: Correlation and Prediction96 Questions
Exam 4: Some Key Ingredients for Inferential Statistics: the Normal Curve, Sample Versus Population, and Probability71 Questions
Exam 5: Introduction to Hypothesis Testing99 Questions
Exam 6: Hypothesis Tests With Means of Samples77 Questions
Exam 7: Making Sense of Statistical Significance: Effect Size and Statistical Power73 Questions
Exam 8: Introduction to the T Test: Single Sample and Dependent Means115 Questions
Exam 9: The T Test for Independent Means85 Questions
Exam 10: Introduction to the Analysis of Variance131 Questions
Exam 11: Chi-Square Tests and Strategies When Population Distributions Are Not Normal124 Questions
Exam 12: Applying Statistical Methods in Your Own Research Project52 Questions
Select questions type
Which of the alternatives best describes the pattern of scores graphed below? 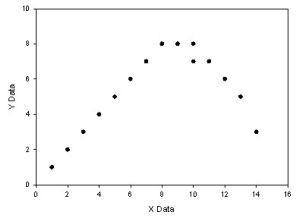
(Multiple Choice)
4.8/5  (37)
(37)
Two variables, A and B, have a strong linear correlation. What is the direction of causality?
(Multiple Choice)
4.8/5 (37)
A researcher discovers that if people eat a certain fruit before a test, the more fruit eaten, the better they do on the test. Beyond a certain point, however, the more fruit eaten the worse people do on the test. The relation between amount of fruit eaten and how well people do on the test is an example of:
(Multiple Choice)
5.0/5 (38)
Which of the alternatives best describes the pattern of scores on the scatter diagram below? 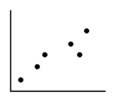
(Multiple Choice)
4.8/5 (43)
All of the following are reasons why Z scores are used to help determine the degree of linear correlation EXCEPT:
(Multiple Choice)
4.9/5 (34)
A researcher studies the relationship between caloric intake and weight gain in a group of 250 adults between the ages of 25 and 40. The correlation between increasing one's caloric intake and subsequent weight gain is found to be .60 (p < .05). What does it mean to say that this particular correlation coefficient is statistically significant?
(Essay)
4.9/5 (30)
Comparisons of the degree of linear correlation are considered most accurate in terms of:
(Multiple Choice)
4.8/5 (35)
Which of the following is the most likely way for the correlation coefficient to be presented in a research article?
(Multiple Choice)
4.7/5 (29)
Who is given credit for inventing the statistic called correlation?
(Multiple Choice)
4.7/5 (25)
The correlation coefficient is named after Pearson. However, it was actually invented by __________.
(Short Answer)
4.8/5 (31)
Suppose that the beta in a particular situation for predicting college grades from high school grades is .4 and that a person had a GPA that was 1 standard deviation above the mean (Z score = +1)in high school. What would the predicted score for that person's GPA in college be?
(Multiple Choice)
4.7/5 (36)
If the correlation coefficient is .45, what is the proportion of variance accounted for?
(Multiple Choice)
4.8/5 (30)
Which of these statements is TRUE when drawing a scatter diagram?
(Multiple Choice)
4.8/5 (37)
In order to make predictions involving raw scores, the first step is to:
(Multiple Choice)
4.7/5 (39)
The standardized regression coefficient is the number you multiply by the Z score of the predictor variable to get the __________ on the criterion variable.
(Short Answer)
4.8/5 (33)
If researchers were to measure a couples' level of exciting activities at one time and then examine the quality of their marriages several years later (as done by Tsapelas, Aron, & Orbuch, 2009), they would be carrying out a:
(Multiple Choice)
4.9/5 (43)
A researcher conducts a study of familiarity with certain unusual words and the time it takes a participant to press a button indicating whether the word is singular or plural. All participants are given the same words. They rate their familiarity with these words (after the reaction-time part)on a 7-point scale (high = familiar). Below are the scores for the first three participants. That is, for Person A, average familiarity of the words used was 6 and average reaction time was 1.25 seconds.
 M = 3.67 SD = 1.70 M = 2.08 SD = .80 r = .87
a. Give the Z score prediction formula for predicting reaction time from familiarity.
b. Predict the reaction time for a person who rates his or her familiarity as a 5.
c. Explain what you have done to a person who is familiar with correlation but not with regression.
M = 3.67 SD = 1.70 M = 2.08 SD = .80 r = .87
a. Give the Z score prediction formula for predicting reaction time from familiarity.
b. Predict the reaction time for a person who rates his or her familiarity as a 5.
c. Explain what you have done to a person who is familiar with correlation but not with regression.
(Essay)
4.8/5 (34)
You conduct a study in which you measure two political attitudes and find a correlation of +.07. This is considered a:
(Multiple Choice)
4.9/5 (39)
Figuring the multiple correlation coefficient allows you to:
(Multiple Choice)
4.9/5 (30)
Place the four steps for computing the correlation coefficient into the correct order: 1. Add up the cross-products of the Z scores.
2) Change all scores to Z scores.
3) Divide by the number of people in the study.
4) Figure the cross-product of the Z scores for each person.
(Multiple Choice)
4.8/5 (32)
Filters
- Essay(0)
- Multiple Choice(0)
- Short Answer(0)
- True False(0)
- Matching(0)