Exam 18: Statistical Quality Control
Exam 1: Introduction to Statistics and Business Analytics180 Questions
Exam 2: Visualizing Data With Charts and Graphs113 Questions
Exam 3: Descriptive Statistics88 Questions
Exam 4: Probability104 Questions
Exam 5: Discrete Distributions98 Questions
Exam 6: Continuous Distributions105 Questions
Exam 7: Sampling and Sampling Distributions97 Questions
Exam 8: Statistical Inference: Estimation for Single Populations94 Questions
Exam 9: Statistical Inference: Hypothesis Testing for Single Populations123 Questions
Exam 10: Statistical Inferences About Two Populations97 Questions
Exam 11: Analysis of Variance and Design of Experiments133 Questions
Exam 12: Simple Regression Analysis and Correlation111 Questions
Exam 13: Multiple Regression Analysis90 Questions
Exam 14: Building Multiple Regression Models100 Questions
Exam 15: Time-Series Forecasting and Index Numbers103 Questions
Exam 16: Analysis of Categorical Data85 Questions
Exam 17: Nonparametric Statistics110 Questions
Exam 18: Statistical Quality Control99 Questions
Exam 19: Decision Analysis109 Questions
Select questions type
Imagine a cause-and-effect diagram had five elements listed at the end of each line, either at the head of the diagram or at the end of each "bone" of the diagram.These elements were transportation, enforcement, late arrivals, policy, and attitude.Of these, which would be most likely to be at the head of the diagram?
(Multiple Choice)
4.8/5  (36)
(36)
Which of the following quality control chart conditions is an indicator that the process is potentially out-of-control?
(Multiple Choice)
4.8/5 (37)
You are conducting a study on the blood glucose levels of 9 patients who are on strict diets and exercise routines.To monitor the mean and range of the blood glucose levels of your patients, you take a blood glucose reading every day for each patient for 20 days.The mean of the 9 sample means is 101.03, and the mean of the 9 standard deviations is 29.243.The lower control limit for your chart is ________.
(Multiple Choice)
4.9/5 (34)
Sarah Soliz, Director of Quality Programs, is designing and R charts for the rod shearing process at Stockton Steel.She has 26 samples of rod length, and each sample included measurements of 5 rods.The mean of the 26 sample means is 112 inches, and mean of the 26 ranges is 0.15 inch.The upper control limit for her R chart is ____.
(Multiple Choice)
4.9/5 (39)
A flowchart can help identify ___________ within the ____________.
(Multiple Choice)
4.9/5 (39)
In reviewing a flowchart, a company would not be able to determine ____________ in a process.
(Multiple Choice)
5.0/5 (39)
A p chart is to be developed for use in quality control.The value of p is calculated to be 0.54.The sample size is 249.What would the upper control limit be?
(Multiple Choice)
4.8/5 (32)
You are conducting a study on the blood glucose levels of 9 patients who are on strict diets and exercise routines.To monitor the mean and range of the blood glucose levels of your patients, you take a blood glucose reading every day for each patient for 20 days.The results are shown below.
Day Mean Range Day Mean Range 1 92.11 80 11 100.70 89 2 90.67 77 12 96.67 77 3 89.44 73 13 97.33 75 4 93.33 81 14 95.89 80 5 89.44 71 15 98.89 68 6 110.20 90 16 101.22 88 7 104.10 120 17 107.33 81 8 108.20 93 18 108.00 95 9 107.70 98 19 106.89 77 10 112.70 145 20 109.89 80
The lower control limit for your chart is ________.
(Multiple Choice)
4.9/5 (27)
Control charts are used to examine the output of a process for disturbing patterns or for data points that indicate that the process is out of control.
(True/False)
4.9/5 (29)
A p chart is to be developed for use in quality control.The value of p is calculated to be 0.05.The sample size is 50.What would the upper control limit be?
(Multiple Choice)
4.8/5 (37)
W.Edwards Deming was a quality guru whose principles of quality management can be summarized through four basic tenets, or "Absolutes".
(True/False)
4.8/5 (39)
Two general types of control charts are (1)control charts for measurements and (2)control charts for compliance items.
(True/False)
4.8/5 (45)
The Six Sigma approach essentially calls for the process to approach defect-free status.
(True/False)
4.9/5 (43)
Jack Joyner, Director of Quality Control at Covington Castings (CC), is designing a c chart to monitor the number of nonconformances per aluminum casting produced at CC.The total number of nonconformances for 26 castings is 91.The upper control limit for Jack's c chart is ___________.
(Multiple Choice)
4.8/5 (35)
Nels Neugent, Purchasing Manager at Mid-West Medical Center, is designing a p chart to monitor the proportion of defective purchase orders issued at Mid-West.He has the proportion of defective orders for 22 samples of purchase orders.Each sample contains 150 purchase orders, and the average proportion defective is 0.08.The centerline for Nels's p chart is ___________.
(Multiple Choice)
4.8/5 (41)
For a p chart, the standard deviation of the proportions is 0.079057.The number of items in each sample is 30.Then p is ______.
(Multiple Choice)
5.0/5 (40)
According to the following Pareto chart, the most common complaint was ______. 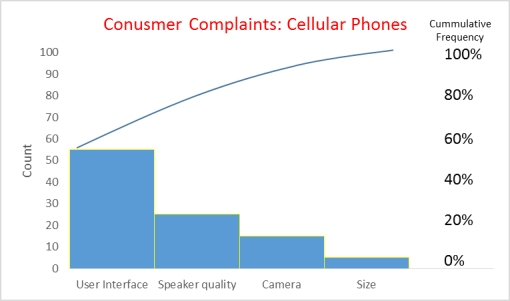
(Multiple Choice)
5.0/5 (35)
Working from a Pareto chart, a company wants to address the two most common causes of interruptions in the company's production process.Managers should focus on the _____________ of the chart.
(Multiple Choice)
4.9/5 (36)
Filters
- Essay(0)
- Multiple Choice(0)
- Short Answer(0)
- True False(0)
- Matching(0)