Exam 18: Statistical Quality Control
Exam 1: Introduction to Statistics and Business Analytics180 Questions
Exam 2: Visualizing Data With Charts and Graphs113 Questions
Exam 3: Descriptive Statistics88 Questions
Exam 4: Probability104 Questions
Exam 5: Discrete Distributions98 Questions
Exam 6: Continuous Distributions105 Questions
Exam 7: Sampling and Sampling Distributions97 Questions
Exam 8: Statistical Inference: Estimation for Single Populations94 Questions
Exam 9: Statistical Inference: Hypothesis Testing for Single Populations123 Questions
Exam 10: Statistical Inferences About Two Populations97 Questions
Exam 11: Analysis of Variance and Design of Experiments133 Questions
Exam 12: Simple Regression Analysis and Correlation111 Questions
Exam 13: Multiple Regression Analysis90 Questions
Exam 14: Building Multiple Regression Models100 Questions
Exam 15: Time-Series Forecasting and Index Numbers103 Questions
Exam 16: Analysis of Categorical Data85 Questions
Exam 17: Nonparametric Statistics110 Questions
Exam 18: Statistical Quality Control99 Questions
Exam 19: Decision Analysis109 Questions
Select questions type
Quality control can be undertaken in two distinct ways: after-process control and before-process control.
(True/False)
4.7/5  (39)
(39)
An R Chart is to be developed for use in quality control.The average of the ranges is calculated to be 0.45.The sample sizes were 9 each.What would the upper control limit be?
(Multiple Choice)
4.9/5 (34)
Nels Neugent, Purchasing Manager at Mid-West Medical Center, is designing a p chart to monitor the proportion of defective purchase orders issued at Mid-West.He has the proportions defective for 22 samples of purchase orders.Each sample contains 150 purchase orders, and the average proportion defective is 0.08.The lower control limit for Nels's p chart is ___________.
(Multiple Choice)
5.0/5 (34)
Higher output wattage means higher quality to some consumers of audio amplifiers.Among Garvin's five quality types, this is an example of ______________.
(Multiple Choice)
4.8/5 (36)
In many public restrooms, management will keep a sheet on the back of the door noting the times that the restroom is to be cleaned as the column headings and each row denoting a step of the cleaning to be completed.This would be an example of a __________.
(Multiple Choice)
4.8/5 (34)
Ophelia O'Brien, VP of Consumer Credit of American First Banks (AFB), is designing a p chart to monitor the default rate on personal loans at the AFB member banks.Her data include the proportion in default for 30 samples of personal loans.Each sample contains 50 loans, and the average of the 30 proportions is 0.05.The lower control limit for Ophelia's p chart is _____________.
(Multiple Choice)
4.8/5 (37)
The Pareto principle would suggest that a quality improvement team focus their efforts on those problems that account for 80% of the complaints.Based on this principle and the Pareto chart below, the team should focus their efforts on which of the following complaints? 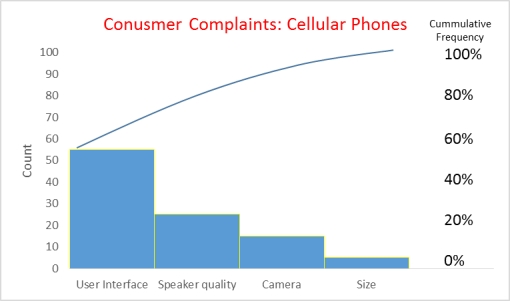
(Multiple Choice)
4.9/5 (32)
A histogram is often used by researchers to gain a(n)_______________ of the data.
(Multiple Choice)
4.8/5 (33)
Jake Flanaghan, Vice President for the inpatient pharmacy at Great Atlantic Medical Center, is designing a c chart to monitor the number of inpatient medication errors that occur each month.The total number of medication errors for January - December last year was 37.The upper control limit for Jake's c chart is ___________.
(Multiple Choice)
4.8/5 (28)
In a flow chart, an oval represents a start or stop in the process.
(True/False)
4.8/5 (36)
The strategy called Total Quality Management (TQM)was embodied in the principles advocated by the well-known quality guru, W.Edwards Deming.
(True/False)
4.8/5 (37)
An R Chart is to be developed for use in quality control.The average of the ranges is calculated to be 0.60.This was based on several samples of size 7 each.What would the upper control limit be?
(Multiple Choice)
4.9/5 (35)
Another name for a cause-and-effect diagram is a herringbone diagram.
(True/False)
4.8/5 (38)
Upper and lower control limits are usually based upon _______.
(Multiple Choice)
4.8/5 (32)
You are conducting a study on the blood glucose levels of 9 patients who are on strict diets and exercise routines.To monitor the mean and range of the blood glucose levels of your patients, you take a blood glucose reading every day for each patient for 20 days.The results are shown below.
Day Mean Range Day Mean Range 1 92.11 80 11 100.70 89 2 90.67 77 12 96.67 77 3 89.44 73 13 97.33 75 4 93.33 81 14 95.89 80 5 89.44 71 15 98.89 68 6 110.20 90 16 101.22 88 7 104.10 120 17 107.33 81 8 108.20 93 18 108.00 95 9 107.70 98 19 106.89 77 10 112.70 145 20 109.89 80
The upper control limit for your chart is ________.
(Multiple Choice)
4.8/5 (37)
An chart is being developed using 15 samples of size 9 each.The average of 15 sample means is 6.20.The average of the 15 ranges is 0.30.The lower control limit is _______________.
(Multiple Choice)
4.9/5 (30)
A graph that plots the proportions of items in noncompliance for multiple samples is called a(n)_______.
(Multiple Choice)
4.8/5 (39)
Filters
- Essay(0)
- Multiple Choice(0)
- Short Answer(0)
- True False(0)
- Matching(0)