Exam 11: Production and Cost Analysis I
Exam 1: Economics and Economic Reasoning121 Questions
Exam 2: The Production Possibility Model, Trade, and Globalization111 Questions
Exam 3: Economic Institutions144 Questions
Exam 4: Supply and Demand151 Questions
Exam 5: Using Supply and Demand136 Questions
Exam 6: Describing Supply and Demand: Elasticities176 Questions
Exam 7: Taxation and Government Intervention169 Questions
Exam 8: Market Failure Versus Government Failure160 Questions
Exam 9: Comparative Advantage, Exchange Rates, and Globalization107 Questions
Exam 10: International Trade Policy82 Questions
Exam 11: Production and Cost Analysis I160 Questions
Exam 12: Production and Cost Analysis II129 Questions
Exam 13: Perfect Competition137 Questions
Exam 14: Monopoly and Monopolistic Competition231 Questions
Exam 15: Oligopoly and Antitrust Policy111 Questions
Exam 16: Real-World Competition and Technology86 Questions
Exam 17: Work and the Labor Market130 Questions
Exam 18: Who Gets What the Distribution of Income100 Questions
Exam 19: The Logic of Individual Choice: the Foundation of Supply and Demand134 Questions
Exam 20: Game Theory, Strategic Decision Making, and Behavioral Economics76 Questions
Exam 21: Thinking Like a Modern Economist67 Questions
Exam 22: Behavioral Economics and Modern Economic Policy87 Questions
Exam 23: Microeconomic Policy, Economic Reasoning, and Beyond111 Questions
Select questions type
Refer to the table shown. At what level of employment is the marginal product of labor 7? Number of workers Total output 1 4 2 10 3 18 4 28 5 35 6 41 7 45 8 48 9 50 10 49
(Multiple Choice)
4.7/5  (32)
(32)
The following graph shows average fixed costs, average variable costs, average total costs, and marginal costs of production. 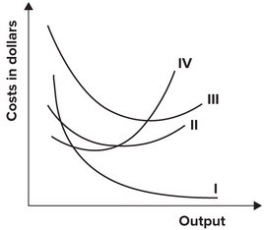 The average total cost curve is represented by which curve?
(Multiple Choice)
4.9/5 (41)
Accounting profit and economic profit differ because economic profit does not take into account opportunity cost.
(True/False)
4.8/5 (34)
Suppose you operate a factory that produces gadgets. Your current output is 1,000 gadgets. If your fixed cost is $10,000 and your total cost is $50,000, the:
(Multiple Choice)
4.8/5 (39)
Refer to the table shown. The average total cost of producing 5 units of output is: Units of output Total cost 0 5 1 11 2 16 3 20 4 23 5 25 6 26
(Multiple Choice)
4.8/5 (42)
Refer to the table shown. The average variable cost of producing 5 units of output is: Units of output Total cost 0 5 1 11 2 16 3 20 4 23 5 25 6 26
(Multiple Choice)
4.8/5 (36)
Refer to the graph shown. Within which section(s) of the production function is marginal product increasing? 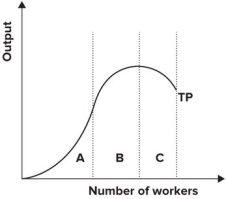
(Multiple Choice)
4.9/5 (36)
At the level of output where marginal product begins to fall, marginal costs will:
(Multiple Choice)
4.8/5 (40)
In the long run all inputs are variable; in the short run some inputs are fixed.
(True/False)
4.8/5 (40)
The law of diminishing marginal productivity implies that the marginal product of a variable input:
(Multiple Choice)
4.9/5 (36)
Refer to the table shown. The firm would definitely not hire: Number of workers Total output 1 4 2 10 3 18 4 28 5 35 6 41 7 45 8 48 9 50 10 49
(Multiple Choice)
4.9/5 (41)
Robert withdrew $100,000 from an account that paid 10 percent annual interest and used the funds to purchase real estate. After one year he sold the property for $120,000. The accounting profit on this deal was:
(Multiple Choice)
4.7/5 (43)
Which of the following is an example of a short-run decision?
(Multiple Choice)
4.8/5 (41)
Filters
- Essay(0)
- Multiple Choice(0)
- Short Answer(0)
- True False(0)
- Matching(0)