Exam 11: Production and Cost Analysis I
Exam 1: Economics and Economic Reasoning121 Questions
Exam 2: The Production Possibility Model, Trade, and Globalization111 Questions
Exam 3: Economic Institutions144 Questions
Exam 4: Supply and Demand151 Questions
Exam 5: Using Supply and Demand136 Questions
Exam 6: Describing Supply and Demand: Elasticities176 Questions
Exam 7: Taxation and Government Intervention169 Questions
Exam 8: Market Failure Versus Government Failure160 Questions
Exam 9: Comparative Advantage, Exchange Rates, and Globalization107 Questions
Exam 10: International Trade Policy82 Questions
Exam 11: Production and Cost Analysis I160 Questions
Exam 12: Production and Cost Analysis II129 Questions
Exam 13: Perfect Competition137 Questions
Exam 14: Monopoly and Monopolistic Competition231 Questions
Exam 15: Oligopoly and Antitrust Policy111 Questions
Exam 16: Real-World Competition and Technology86 Questions
Exam 17: Work and the Labor Market130 Questions
Exam 18: Who Gets What the Distribution of Income100 Questions
Exam 19: The Logic of Individual Choice: the Foundation of Supply and Demand134 Questions
Exam 20: Game Theory, Strategic Decision Making, and Behavioral Economics76 Questions
Exam 21: Thinking Like a Modern Economist67 Questions
Exam 22: Behavioral Economics and Modern Economic Policy87 Questions
Exam 23: Microeconomic Policy, Economic Reasoning, and Beyond111 Questions
Select questions type
Refer to the graph shown. The line segment that represents average fixed costs of producing Q* is: 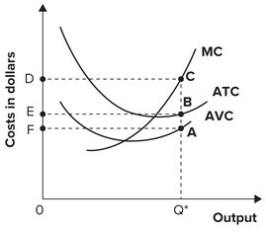
(Multiple Choice)
4.9/5  (35)
(35)
The following graph shows average fixed costs, average variable costs, average total costs, and marginal costs of production.  The average fixed cost curve is represented by which curve?
(Multiple Choice)
4.8/5 (34)
The minimum point of the average total cost curve always occurs at a larger output level than the minimum point of the average variable cost curve because:
(Multiple Choice)
4.8/5 (43)
Refer to the table shown. Marginal product declines when which worker is hired? Number of workers Mar ginal product of workers 1 2 2 5 3 9 4 14 5 16 6 17 7 18 8 18 9 17 10 15
(Multiple Choice)
4.8/5 (41)
Refer to the following graph. 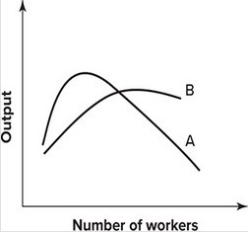 The marginal product and average product curves:
(Multiple Choice)
4.9/5 (33)
Refer to the graph shown. The line segment that represents average total costs of producing Q* is: 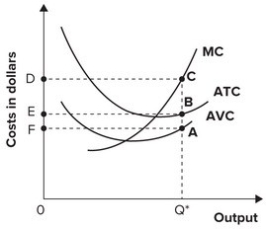
(Multiple Choice)
4.8/5 (46)
The following graph shows average fixed costs, average variable costs, average total costs, and marginal costs of production. 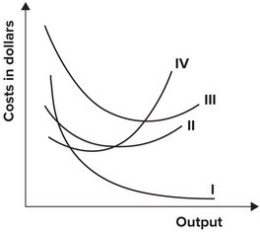 The average variable cost curve is represented by which curve?
(Multiple Choice)
4.9/5 (41)
Rachel left her job as a graphic artist, where she earned $42,000 per year, to open her own graphic arts firm. Her total costs of the new business include:
(Multiple Choice)
4.8/5 (38)
As output increases, average total cost always falls because average fixed cost declines.
(True/False)
4.8/5 (44)
When the average variable cost curve is at its minimum point, average product will be:
(Multiple Choice)
4.8/5 (34)
The only variable input used in producing bicycles in a small factory is labor. Currently four workers are employed; each works 40 hours per week and is paid $10 per hour. If fixed cost is $2,000 per week and total output is 10 bicycles per week, average cost is:
(Multiple Choice)
4.8/5 (42)
If marginal cost is greater than average total cost, average total cost:
(Multiple Choice)
4.8/5 (38)
The following graph shows average fixed costs, average variable costs, average total costs, and marginal costs of production. 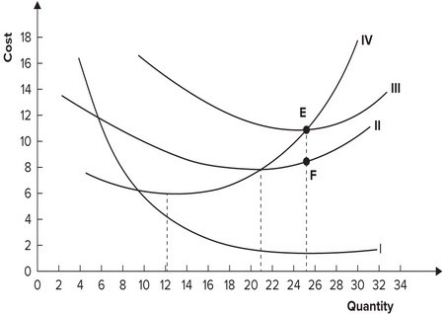 The distance EF represents:
(Multiple Choice)
4.8/5 (34)
If a firm's average fixed cost is $4 and its average total cost is $6, its average variable cost is:
(Multiple Choice)
4.9/5 (41)
If the average cost of producing 10 sweaters is $6.50 and the marginal cost of producing the tenth sweater is $6.75, the average cost of producing 10 sweaters will be:
(Multiple Choice)
4.8/5 (37)
Filters
- Essay(0)
- Multiple Choice(0)
- Short Answer(0)
- True False(0)
- Matching(0)