Exam 11: Production and Cost Analysis I
Exam 1: Economics and Economic Reasoning121 Questions
Exam 2: The Production Possibility Model, Trade, and Globalization111 Questions
Exam 3: Economic Institutions144 Questions
Exam 4: Supply and Demand151 Questions
Exam 5: Using Supply and Demand136 Questions
Exam 6: Describing Supply and Demand: Elasticities176 Questions
Exam 7: Taxation and Government Intervention169 Questions
Exam 8: Market Failure Versus Government Failure160 Questions
Exam 9: Comparative Advantage, Exchange Rates, and Globalization107 Questions
Exam 10: International Trade Policy82 Questions
Exam 11: Production and Cost Analysis I160 Questions
Exam 12: Production and Cost Analysis II129 Questions
Exam 13: Perfect Competition137 Questions
Exam 14: Monopoly and Monopolistic Competition231 Questions
Exam 15: Oligopoly and Antitrust Policy111 Questions
Exam 16: Real-World Competition and Technology86 Questions
Exam 17: Work and the Labor Market130 Questions
Exam 18: Who Gets What the Distribution of Income100 Questions
Exam 19: The Logic of Individual Choice: the Foundation of Supply and Demand134 Questions
Exam 20: Game Theory, Strategic Decision Making, and Behavioral Economics76 Questions
Exam 21: Thinking Like a Modern Economist67 Questions
Exam 22: Behavioral Economics and Modern Economic Policy87 Questions
Exam 23: Microeconomic Policy, Economic Reasoning, and Beyond111 Questions
Select questions type
The following graph shows average fixed costs, average variable costs, average total costs, and marginal costs of production. 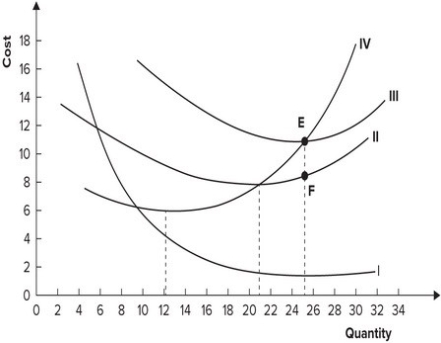 Why does the distance between curves II and III get smaller as quantity increases?
(Multiple Choice)
4.9/5  (29)
(29)
A factory producing calculators employs four workers. At current levels of operation each worker produces 40 calculators per week. Assuming labor is the only variable input and the weekly wage is $400 per worker:
(Multiple Choice)
4.7/5 (36)
The vertical distance between the average total cost curve and the average variable cost curve is:
(Multiple Choice)
4.8/5 (35)
If marginal cost is less than average variable cost, average variable cost will:
(Multiple Choice)
4.9/5 (32)
Whenever the marginal cost curve lies below the average total cost curve, the:
(Multiple Choice)
4.8/5 (33)
When labor is the variable input, the average product equals the:
(Multiple Choice)
4.8/5 (37)
If average fixed cost is $2 and average variable cost is $3, total cost is $5.
(True/False)
4.8/5 (27)
Refer to the table shown. If the output of bicycles is 4 per week, the marginal cost of producing another bicycle per week is: Output (bicycles per week) Total cast (dollars) 1 100 2 200 3 310 4 440 5 580 6 730 7 900 8 1,200
(Multiple Choice)
4.9/5 (39)
The average total cost of producing electronic calculators in a factory is $20 at the current output level of 100 units per week. If fixed cost is $1,000 per week:
(Multiple Choice)
4.9/5 (36)
Which of the following is the best example of a long-run decision?
(Multiple Choice)
4.8/5 (35)
Refer to the table shown. Marginal cost is minimized when how many units of output are produced? Units of output Total cost 0 5 1 11 2 16 3 20 4 23 5 25 6 26
(Multiple Choice)
4.9/5 (40)
Suppose you operate a factory that produces 500 lawn mowers a week. If your weekly variable cost is $40,000 and your weekly total cost is $50,000, the average:
(Multiple Choice)
4.9/5 (39)
Which short-run cost curve continually declines as output increases?
(Multiple Choice)
4.7/5 (38)
Filters
- Essay(0)
- Multiple Choice(0)
- Short Answer(0)
- True False(0)
- Matching(0)