Exam 5: Using Supply and Demand
Exam 1: Economics and Economic Reasoning121 Questions
Exam 2: The Production Possibility Model, Trade, and Globalization111 Questions
Exam 3: Economic Institutions144 Questions
Exam 4: Supply and Demand151 Questions
Exam 5: Using Supply and Demand136 Questions
Exam 6: Describing Supply and Demand: Elasticities176 Questions
Exam 7: Taxation and Government Intervention169 Questions
Exam 8: Market Failure Versus Government Failure160 Questions
Exam 9: Comparative Advantage, Exchange Rates, and Globalization107 Questions
Exam 10: International Trade Policy82 Questions
Exam 11: Production and Cost Analysis I160 Questions
Exam 12: Production and Cost Analysis II129 Questions
Exam 13: Perfect Competition137 Questions
Exam 14: Monopoly and Monopolistic Competition231 Questions
Exam 15: Oligopoly and Antitrust Policy111 Questions
Exam 16: Real-World Competition and Technology86 Questions
Exam 17: Work and the Labor Market130 Questions
Exam 18: Who Gets What the Distribution of Income100 Questions
Exam 19: The Logic of Individual Choice: the Foundation of Supply and Demand134 Questions
Exam 20: Game Theory, Strategic Decision Making, and Behavioral Economics76 Questions
Exam 21: Thinking Like a Modern Economist67 Questions
Exam 22: Behavioral Economics and Modern Economic Policy87 Questions
Exam 23: Microeconomic Policy, Economic Reasoning, and Beyond111 Questions
Select questions type
After several years of slow economic growth, world demand for petroleum began to rise rapidly in the 1990s. Much of the increase in demand was met by additional supplies from sources outside OPEC. OPEC during this time was unable to restrain output among members in its effort to lift oil prices. What best describes these events?
(Multiple Choice)
4.8/5  (36)
(36)
At a Chicago Bulls game 20,000 tickets were sold at $30 apiece. The game was sold out and some people did not get tickets. This suggests that the selling price:
(Multiple Choice)
4.9/5 (43)
Singapore has a system of traffic regulation called Electronic Road Pricing, in which traffic congestion is reduced by charging motorists who drive into the city center during certain hours of the day. Charging for use of a road is:
(Multiple Choice)
4.9/5 (36)
If government were to issue a fixed number of licenses to produce a good or provide a service, this would likely:
(Multiple Choice)
4.9/5 (38)
Suppose that initially, the equations for demand and supply are Qd = 48 − 4P and Qs = 4P − 16, respectively. If the quantity demanded increases by 12 at every price (so that the demand curve shifts to the right), the equilibrium price will change from:
(Multiple Choice)
5.0/5 (40)
Stricter environmental regulations and increased demand for energy have caused an increase in the demand for relatively clean natural gas. In the last several years, improved extraction technologies and new discoveries have increased the availability of natural gas. What has been the net effect on price and quantity for natural gas?
(Multiple Choice)
4.9/5 (35)
Given the equations for demand and supply: Qd = 48 − 4P and Qs = 4P − 16, respectively, the market is in equilibrium when the quantity bought and sold is:
(Multiple Choice)
4.8/5 (41)
When an effective price ceiling is removed, we would expect the price of the good to:
(Multiple Choice)
4.7/5 (33)
Real-world experience shows that when weather conditions reduce crop yields, the price of agricultural products will fall.
(True/False)
4.9/5 (40)
Refer to the graph shown that depicts a third-party payer market for prescription drugs. What is the cost of this program to the third-party if a $2 co-pay is established? 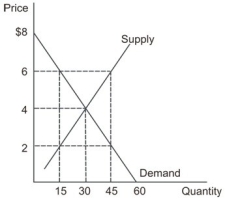
(Multiple Choice)
4.8/5 (30)
Refer to the following graph. 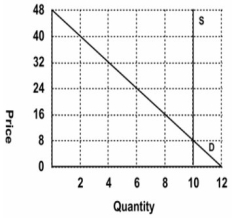 Which of the following pairs of equations describes the supply and demand curves?
(Multiple Choice)
4.9/5 (43)
When the polio vaccine first became available in the United States, the government controlled the price with an effective price ceiling. Production of the vaccine was not sufficient to fill all orders and the government had to regulate its distribution. Had the vaccine been sold without government intervention, the shortage would have been eliminated by price:
(Multiple Choice)
4.9/5 (40)
Consider a market for fish whose market demand and market supply for fish are specified as Qd = 300 − 2.5P and Qs = − 20 + 1.5P, respectively. The government decides to impose a price ceiling of $50 per ton. The possible black market price after the ceiling is:
(Multiple Choice)
4.9/5 (34)
Suppose that there is a renewed interest in eating caviar at the same time that the supply of Russian caviar shrinks. What would be the most likely effect of these events on the price and quantity of caviar sold?
(Multiple Choice)
4.7/5 (36)
Refer to the table shown that depicts a third-party payer market. What is the price the supplier will charge for the quantity consumers demand if a $1 co-pay is established? Price Quantity Demanded Quantity Supplied \ 0 1,200 0 \ 1 600 150 \ 2 300 300 \ 3 0 450 \ 4 0 600 \ 5 0 750 \ 6 0 900 \ 7 0 1,050
(Multiple Choice)
4.8/5 (37)
Refer to the following graph. 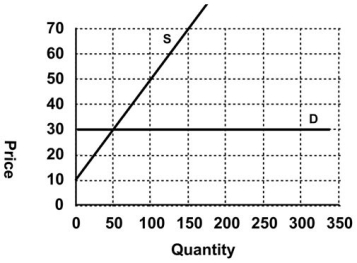 Which of the following pairs of equations describes the supply and demand curves?
(Multiple Choice)
4.8/5 (32)
Refer to the graph shown. A quantity restriction of QR will: 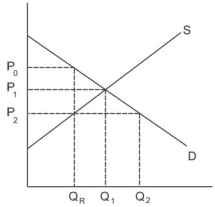
(Multiple Choice)
4.9/5 (22)
Refer to the following graph. 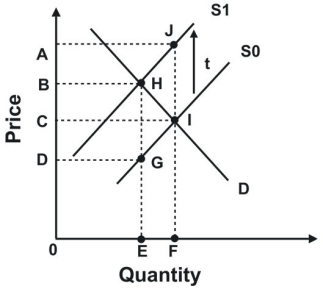 If this graph represents the supply of and demand for an imported product, a tariff of t will result in revenue for the government shown by area:
(Multiple Choice)
4.9/5 (42)
Filters
- Essay(0)
- Multiple Choice(0)
- Short Answer(0)
- True False(0)
- Matching(0)