Exam 18: Who Gets What the Distribution of Income
Exam 1: Economics and Economic Reasoning158 Questions
Exam 2: The Production Possibility Model, Trade, and Globalization133 Questions
Exam 3: Economic Institutions163 Questions
Exam 4: Supply and Demand182 Questions
Exam 5: Using Supply and Demand163 Questions
Exam 6: Describing Supply and Demand: Elasticities216 Questions
Exam 7: Taxation and Government Intervention201 Questions
Exam 8: Market Failure Versus Government Failure197 Questions
Exam 9: Comparative Advantage, Exchange Rates, and Globalization118 Questions
Exam 10: International Trade Policy99 Questions
Exam 11: Production and Cost Analysis I194 Questions
Exam 12: Production and Cost Analysis II152 Questions
Exam 13: Perfect Competition170 Questions
Exam 14: Monopoly and Monopolistic Competition274 Questions
Exam 15: Oligopoly and Antitrust Policy142 Questions
Exam 16: Real-World Competition and Technology108 Questions
Exam 17: Work and the Labor Market150 Questions
Exam 18: Who Gets What the Distribution of Income131 Questions
Exam 19: The Logic of Individual Choice: the Foundation of Supply and Demand170 Questions
Exam 20: Game Theory, Strategic Decision Making, and Behavioral Economics103 Questions
Exam 21: Thinking Like a Modern Economist97 Questions
Exam 22: Behavioral Economics and Modern Economic Policy126 Questions
Exam 23: Microeconomic Policy, Economic Reasoning, and Beyond134 Questions
Exam 24: Economic Growth, Business Cycles, and Unemployment124 Questions
Exam 25: Measuring and Describing the Aggregate Economy229 Questions
Exam 26: The Keynesian Short-Run Policy Model: Demand-Side Policies220 Questions
Exam 27: The Classical Long-Run Policy Model: Growth and Supply-Side Policies133 Questions
Exam 28: The Financial Sector and the Economy214 Questions
Exam 29: Monetary Policy243 Questions
Exam 30: Financial Crises, Panics, and Unconventional Monetary Policy109 Questions
Exam 31: Deficits and Debt: the Austerity Debate150 Questions
Exam 32: The Fiscal Policy Dilemma119 Questions
Exam 33: Jobs and Unemployment78 Questions
Exam 34: Inflation, Deflation, and Macro Policy175 Questions
Exam 35: International Financial Policy211 Questions
Exam 36: Macro Policy in a Global Setting134 Questions
Exam 37: Structural Stagnation and Globalization125 Questions
Exam 38: Macro Policy in Developing Countries142 Questions
Select questions type
Since the minimum food budget used to determine the poverty line is not adjusted for changes in the standard of living, it is, in principle:
(Multiple Choice)
4.8/5  (37)
(37)
For the purpose of determining whether a family is officially considered to be living in poverty, poverty figures do not include:
(Multiple Choice)
4.8/5 (28)
What are the distributive consequences of each of the following taxes: the U.S.income taxes,sales taxes,and property taxes? Are they progressive,regressive,or proportional?
(Essay)
4.9/5 (34)
Refer to the graph shown. 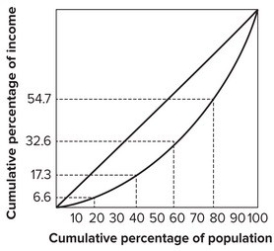 The bottom 20 percent of the families earn:
(Multiple Choice)
4.8/5 (42)
Poverty is defined by the U.S. government as having an income equal to or less than three times an average family's minimum food expenditure as calculated by the U.S. Department of Agriculture.
(True/False)
4.8/5 (37)
How does the Lorenz curve for the U.S.compare to the Lorenz curve for most developing and developed countries? What does this mean?
(Essay)
4.8/5 (36)
The following diagram shows three Lorenz curves for countries A,B,and C.The area between the Lorenz curve and the diagonal is 1,000 for Country A,2,000 for Country B,and 2,500 for Country C.(The entire area under the diagonal is 5,000 because the area of the triangle is ½ × (base × height)= ½ × (100 × 100)= 5,000. )
(1)Calculate the Gini coefficient for each country.
(2)Based on the Gini coefficient,which country has the most equal distribution of income? Which country has the least? 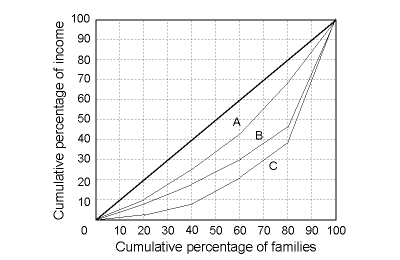
(Essay)
4.8/5 (41)
Refer to the graph shown. 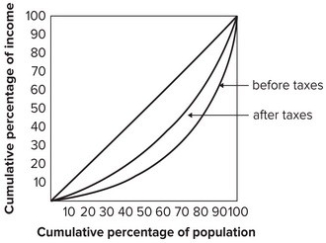 A possible explanation for the difference between the distribution of income before taxes and the distribution of income after taxes shown in the graph is that the tax system:
(Multiple Choice)
4.8/5 (31)
What are the distributive consequences of the U.S.income taxes,the Social Security tax,sales taxes,and property taxes? (Are they progressive,proportional,or regressive?)
(Essay)
4.9/5 (28)
Which program has been very successful in keeping the elderly out of poverty?
(Multiple Choice)
4.8/5 (35)
Refer to the graph shown.  The Lorenz curve showing the most income inequality is
(Multiple Choice)
4.8/5 (43)
Use the table below to answer the questions.
(a)Draw a Lorenz curve for countries A,B,and C in the table below.
(b)Which country has the least equal distribution of income? The most equal distribution?
Percent of Income Quirtile A B C Lowest 8.5 10.2 2.3 fifth Second 10.1 15.2 6.1 fifth Third fifth 12.5 18.3 12.3 Fouth fifth 15.1 23.1 18.1 Highest 53.8 33.2 61.2 fifth 
(Essay)
4.8/5 (38)
Friedrich Nietzsche's views on income distribution and fairness can best be described by the statement:
(Multiple Choice)
4.9/5 (34)
Refer to the graph shown. 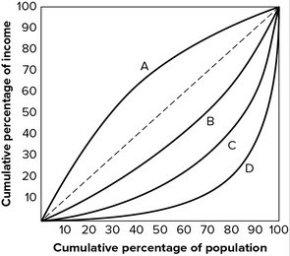 The Lorenz curve showing the most income equality is:
(Multiple Choice)
4.7/5 (34)
How has income distribution changed in the U.S.since 1929? When did inequality decrease and when did it increase?
(Essay)
5.0/5 (37)
Attempts to reduce income inequality may lead to greater income inequality.
(True/False)
4.8/5 (31)
Economists often use a Lorenz curve to describe income distribution.What are two other approaches to the measurement of income distribution?
(Essay)
4.8/5 (34)
Which of the following statements contradicts the evidence shown in the graph shown? 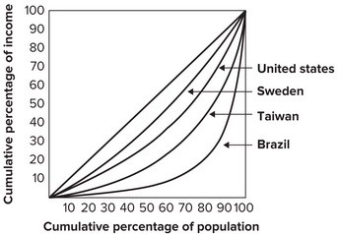
(Multiple Choice)
4.9/5 (41)
Filters
- Essay(0)
- Multiple Choice(0)
- Short Answer(0)
- True False(0)
- Matching(0)