Exam 11: Production and Cost Analysis I
Exam 1: Economics and Economic Reasoning158 Questions
Exam 2: The Production Possibility Model, Trade, and Globalization133 Questions
Exam 3: Economic Institutions163 Questions
Exam 4: Supply and Demand182 Questions
Exam 5: Using Supply and Demand163 Questions
Exam 6: Describing Supply and Demand: Elasticities216 Questions
Exam 7: Taxation and Government Intervention201 Questions
Exam 8: Market Failure Versus Government Failure197 Questions
Exam 9: Comparative Advantage, Exchange Rates, and Globalization118 Questions
Exam 10: International Trade Policy99 Questions
Exam 11: Production and Cost Analysis I194 Questions
Exam 12: Production and Cost Analysis II152 Questions
Exam 13: Perfect Competition170 Questions
Exam 14: Monopoly and Monopolistic Competition274 Questions
Exam 15: Oligopoly and Antitrust Policy142 Questions
Exam 16: Real-World Competition and Technology108 Questions
Exam 17: Work and the Labor Market150 Questions
Exam 18: Who Gets What the Distribution of Income131 Questions
Exam 19: The Logic of Individual Choice: the Foundation of Supply and Demand170 Questions
Exam 20: Game Theory, Strategic Decision Making, and Behavioral Economics103 Questions
Exam 21: Thinking Like a Modern Economist97 Questions
Exam 22: Behavioral Economics and Modern Economic Policy126 Questions
Exam 23: Microeconomic Policy, Economic Reasoning, and Beyond134 Questions
Exam 24: Economic Growth, Business Cycles, and Unemployment124 Questions
Exam 25: Measuring and Describing the Aggregate Economy229 Questions
Exam 26: The Keynesian Short-Run Policy Model: Demand-Side Policies220 Questions
Exam 27: The Classical Long-Run Policy Model: Growth and Supply-Side Policies133 Questions
Exam 28: The Financial Sector and the Economy214 Questions
Exam 29: Monetary Policy243 Questions
Exam 30: Financial Crises, Panics, and Unconventional Monetary Policy109 Questions
Exam 31: Deficits and Debt: the Austerity Debate150 Questions
Exam 32: The Fiscal Policy Dilemma119 Questions
Exam 33: Jobs and Unemployment78 Questions
Exam 34: Inflation, Deflation, and Macro Policy175 Questions
Exam 35: International Financial Policy211 Questions
Exam 36: Macro Policy in a Global Setting134 Questions
Exam 37: Structural Stagnation and Globalization125 Questions
Exam 38: Macro Policy in Developing Countries142 Questions
Select questions type
Refer to the table shown. If total output is 41, level of employment is:
Number of workers Marginal product of workers 1 5 2 7 3 8 4 10 5 11 6 7 7 5 8 3 9 0 10 -1
(Multiple Choice)
4.9/5  (34)
(34)
The vertical distance between the average total cost and average variable cost curves falls as output rises.
(True/False)
4.9/5 (37)
The diagram was intended to illustrate the MC and AVC curves that correspond to each other.Explain why the diagram below is incorrect. 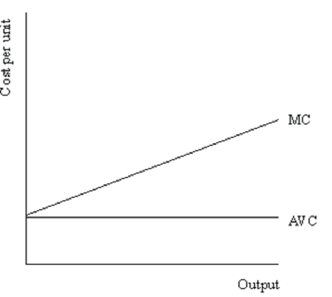
(Essay)
4.8/5 (37)
Refer to the table shown. The average fixed cost of producing eight bicycles is: Output (bicycles per week) Tatal cast (dallars) 1 100 2 200 3 310 4 440 5 580 6 730 7 900 8 1,200
(Multiple Choice)
4.9/5 (50)
If marginal cost is less than average variable cost, average variable cost will:
(Multiple Choice)
4.9/5 (36)
Refer to the graph shown. The line segment that represents average variable costs of producing Q* is: 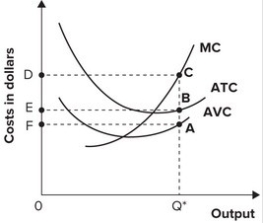
(Multiple Choice)
4.8/5 (33)
Why does the marginal cost curve always cut the average cost curve at the lowest point on the AC curve?
(Essay)
4.8/5 (38)
Refer to the table shown. The average product when eight workers are employed is:
Number of workers Total output 1 4 2 10 3 18 4 28 5 35 6 41 7 45 8 48 9 50 10 49
(Multiple Choice)
4.9/5 (37)
When output is 500, a firm's fixed costs are $10,000 and its variable costs are $15,000. The firm's total costs are therefore:
(Multiple Choice)
4.9/5 (40)
If the law of diminishing marginal productivity holds true, eventually both the marginal cost curve and the average cost curve must become:
(Multiple Choice)
4.9/5 (33)
Demonstrate graphically and explain verbally why the MC curve always goes through the minimum point of the AVC curve.
(Essay)
4.9/5 (35)
Refer to the table shown. Diminishing marginal productivity begins when the:
Number of workers Total output 1 4 2 10 3 18 4 28 5 35 6 41 7 45 8 48 9 50 10 49
(Multiple Choice)
4.8/5 (31)
The following graph shows average fixed costs, average variable costs, average total costs, and marginal costs of production. 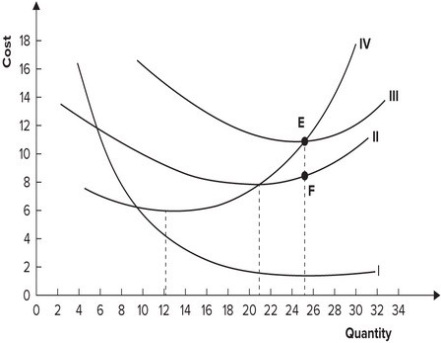 Why does the distance between curves II and III get smaller as quantity increases?
(Multiple Choice)
4.8/5 (38)
Refer to the graph shown. Within which section(s)of the production function is marginal product increasing? 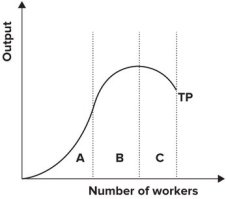
(Multiple Choice)
4.8/5 (33)
Filters
- Essay(0)
- Multiple Choice(0)
- Short Answer(0)
- True False(0)
- Matching(0)