Exam 11: Production and Cost Analysis I
Exam 1: Economics and Economic Reasoning158 Questions
Exam 2: The Production Possibility Model, Trade, and Globalization133 Questions
Exam 3: Economic Institutions163 Questions
Exam 4: Supply and Demand182 Questions
Exam 5: Using Supply and Demand163 Questions
Exam 6: Describing Supply and Demand: Elasticities216 Questions
Exam 7: Taxation and Government Intervention201 Questions
Exam 8: Market Failure Versus Government Failure197 Questions
Exam 9: Comparative Advantage, Exchange Rates, and Globalization118 Questions
Exam 10: International Trade Policy99 Questions
Exam 11: Production and Cost Analysis I194 Questions
Exam 12: Production and Cost Analysis II152 Questions
Exam 13: Perfect Competition170 Questions
Exam 14: Monopoly and Monopolistic Competition274 Questions
Exam 15: Oligopoly and Antitrust Policy142 Questions
Exam 16: Real-World Competition and Technology108 Questions
Exam 17: Work and the Labor Market150 Questions
Exam 18: Who Gets What the Distribution of Income131 Questions
Exam 19: The Logic of Individual Choice: the Foundation of Supply and Demand170 Questions
Exam 20: Game Theory, Strategic Decision Making, and Behavioral Economics103 Questions
Exam 21: Thinking Like a Modern Economist97 Questions
Exam 22: Behavioral Economics and Modern Economic Policy126 Questions
Exam 23: Microeconomic Policy, Economic Reasoning, and Beyond134 Questions
Exam 24: Economic Growth, Business Cycles, and Unemployment124 Questions
Exam 25: Measuring and Describing the Aggregate Economy229 Questions
Exam 26: The Keynesian Short-Run Policy Model: Demand-Side Policies220 Questions
Exam 27: The Classical Long-Run Policy Model: Growth and Supply-Side Policies133 Questions
Exam 28: The Financial Sector and the Economy214 Questions
Exam 29: Monetary Policy243 Questions
Exam 30: Financial Crises, Panics, and Unconventional Monetary Policy109 Questions
Exam 31: Deficits and Debt: the Austerity Debate150 Questions
Exam 32: The Fiscal Policy Dilemma119 Questions
Exam 33: Jobs and Unemployment78 Questions
Exam 34: Inflation, Deflation, and Macro Policy175 Questions
Exam 35: International Financial Policy211 Questions
Exam 36: Macro Policy in a Global Setting134 Questions
Exam 37: Structural Stagnation and Globalization125 Questions
Exam 38: Macro Policy in Developing Countries142 Questions
Select questions type
Suppose you operate a factory that produces gadgets. Your current output is 1,000 gadgets. If your fixed cost is $10,000 and your total cost is $50,000, the:
(Multiple Choice)
4.8/5  (38)
(38)
Whenever the marginal cost curve lies below the average total cost curve, the:
(Multiple Choice)
4.8/5 (32)
When average total cost is rising, the marginal cost curve must be above the average total cost curve.
(True/False)
4.7/5 (37)
The relationship between the quantity of inputs and the quantity of output is called the:
(Multiple Choice)
4.7/5 (43)
Rachel left her job as a graphic artist, where she earned $42,000 per year, to open her own graphic arts firm. Her implicit costs of the new business include:
(Multiple Choice)
4.7/5 (39)
Refer to the table shown. The average fixed cost of producing 5 units of output is: Units of output Total cost 0 5 1 11 2 16 3 20 4 23 5 25 6 26
(Multiple Choice)
4.9/5 (33)
The diagram was intended to illustrate the MP and AP curves that correspond to each other.Explain why the diagram below is incorrect. 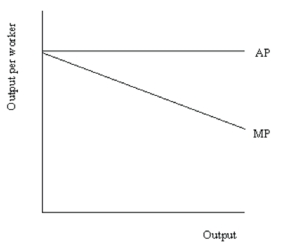
(Essay)
4.9/5 (31)
A firm's total variable cost increases from $4,000 to $4,020 as the firm increases its output from 400 to 401 units. What is the marginal cost of producing the 401st unit?
(Multiple Choice)
4.9/5 (36)
Can accounting profit be positive while economic profits are negative?
(Multiple Choice)
4.9/5 (30)
Implicit and explicit revenues minus implicit and explicit costs equals:
(Multiple Choice)
4.8/5 (38)
The following graph shows average fixed costs, average variable costs, average total costs, and marginal costs of production. 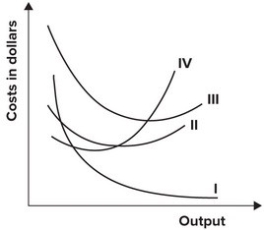 The average total cost curve is represented by which curve?
(Multiple Choice)
5.0/5 (36)
A regional airline owns 10 aircraft and employs 20 pilots. The airline makes an average of three trips per day with each of its 10 aircraft. The aircraft and their ground crews are idle part of the day. Minimum rest requirements for its pilots mean that if the airline wants to increase its flights, it must hire more pilots. The decision to hire more pilots is:
(Multiple Choice)
4.7/5 (36)
Refer to the graph shown. The line segment that represents average fixed costs of producing Q* is: 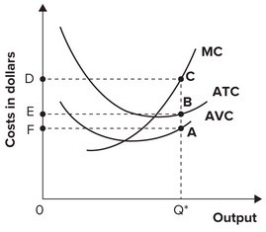
(Multiple Choice)
4.8/5 (46)
Refer to the table shown. The average variable cost of producing 5 units of output is: Units of output Total cost 0 5 1 11 2 16 3 20 4 23 5 25 6 26
(Multiple Choice)
4.7/5 (32)
If the average cost of producing 10 sweaters is $6.50 and the marginal cost of producing the tenth sweater is $6.25, the average cost of producing 10 sweaters will be:
(Multiple Choice)
4.9/5 (32)
Draw and correctly label a typical set of AFC,ATC,AVC,and MC cost curves.
(Essay)
4.9/5 (40)
Owen runs a delivery business and currently employs three drivers. He owns three vans that employees use to make deliveries, but he is considering hiring a fourth driver. If he hires a fourth driver, he can schedule breaks and lunch hours so that all three vans are in constant use, allowing him to increase deliveries per day from 60 to 75. It will cost an additional $75 per day to hire the fourth driver. The marginal cost per delivery of increasing output beyond 60 deliveries per day:
(Multiple Choice)
4.8/5 (38)
Filters
- Essay(0)
- Multiple Choice(0)
- Short Answer(0)
- True False(0)
- Matching(0)