Exam 11: Production and Cost Analysis I
Exam 1: Economics and Economic Reasoning158 Questions
Exam 2: The Production Possibility Model, Trade, and Globalization133 Questions
Exam 3: Economic Institutions163 Questions
Exam 4: Supply and Demand182 Questions
Exam 5: Using Supply and Demand163 Questions
Exam 6: Describing Supply and Demand: Elasticities216 Questions
Exam 7: Taxation and Government Intervention201 Questions
Exam 8: Market Failure Versus Government Failure197 Questions
Exam 9: Comparative Advantage, Exchange Rates, and Globalization118 Questions
Exam 10: International Trade Policy99 Questions
Exam 11: Production and Cost Analysis I194 Questions
Exam 12: Production and Cost Analysis II152 Questions
Exam 13: Perfect Competition170 Questions
Exam 14: Monopoly and Monopolistic Competition274 Questions
Exam 15: Oligopoly and Antitrust Policy142 Questions
Exam 16: Real-World Competition and Technology108 Questions
Exam 17: Work and the Labor Market150 Questions
Exam 18: Who Gets What the Distribution of Income131 Questions
Exam 19: The Logic of Individual Choice: the Foundation of Supply and Demand170 Questions
Exam 20: Game Theory, Strategic Decision Making, and Behavioral Economics103 Questions
Exam 21: Thinking Like a Modern Economist97 Questions
Exam 22: Behavioral Economics and Modern Economic Policy126 Questions
Exam 23: Microeconomic Policy, Economic Reasoning, and Beyond134 Questions
Exam 24: Economic Growth, Business Cycles, and Unemployment124 Questions
Exam 25: Measuring and Describing the Aggregate Economy229 Questions
Exam 26: The Keynesian Short-Run Policy Model: Demand-Side Policies220 Questions
Exam 27: The Classical Long-Run Policy Model: Growth and Supply-Side Policies133 Questions
Exam 28: The Financial Sector and the Economy214 Questions
Exam 29: Monetary Policy243 Questions
Exam 30: Financial Crises, Panics, and Unconventional Monetary Policy109 Questions
Exam 31: Deficits and Debt: the Austerity Debate150 Questions
Exam 32: The Fiscal Policy Dilemma119 Questions
Exam 33: Jobs and Unemployment78 Questions
Exam 34: Inflation, Deflation, and Macro Policy175 Questions
Exam 35: International Financial Policy211 Questions
Exam 36: Macro Policy in a Global Setting134 Questions
Exam 37: Structural Stagnation and Globalization125 Questions
Exam 38: Macro Policy in Developing Countries142 Questions
Select questions type
You run a small business producing picture frames. This month your total cost is $10,000, your variable cost is $5,000, and your output is 5,000 picture frames. Given this information, your:
(Multiple Choice)
4.8/5  (37)
(37)
Which short-run cost curve continually declines as output increases?
(Multiple Choice)
4.8/5 (33)
Suppose you operate a factory that produces 500 lawn mowers a week. If your weekly variable cost is $40,000 and your weekly total cost is $50,000, the average:
(Multiple Choice)
4.7/5 (44)
Refer to the table shown. If the number of workers is three, total output is:
Number of workers Marginal product of workers 1 2 2 5 3 9 4 14 5 16 6 17 7 18 8 18 9 17 10 15
(Multiple Choice)
4.8/5 (40)
If your cell phone bill is $40 when you use up to 300 minutes per month or $80 when you use between 300 and 400 minutes per month, the marginal cost of the 301st minute is:
(Multiple Choice)
4.7/5 (40)
(a)Calculate marginal costs,total costs,average fixed costs,average variable costs and average total costs,given the following table.Costs are $100 when there is no production.Round off to the nearest whole number.
Output Variable Cost Marginal Cost Total Cost Average Fixed Cost Average Variable Cost Average Total Cost 0 0 0 1 60 60 2 90 30 3 110 20 4 150 40 5 230 80 6 350 120 7 510 160 8 710 200 (b)Between what levels of output is there increasing marginal productivity?
(c)If labor were the only input to this production process,between what levels of output is the marginal product of labor falling?
(Essay)
4.8/5 (40)
When output is 20, fixed costs are $100 and variable costs are $400. When output rises to 21, fixed costs are $100 and variable costs are $450. This implies that the marginal cost of the last unit of output equals:
(Multiple Choice)
4.9/5 (41)
Refer to the table shown. The average variable cost of producing five bicycles per week is: Output (bicycles per week) Tatal cast (dallars) 1 100 2 200 3 310 4 440 5 580 6 730 7 900 8 1,200
(Multiple Choice)
4.8/5 (44)
The following graph shows average fixed costs, average variable costs, average total costs, and marginal costs of production. 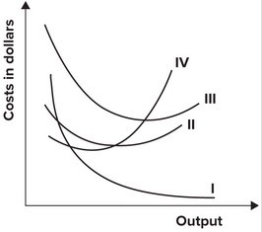 In the graph shown, the marginal cost curve is represented by which curve?
(Multiple Choice)
4.9/5 (43)
Robert withdrew $100,000 from an account that paid 10 percent annual interest and used the funds to purchase real estate. After one year he sold the property for $120,000. The accounting profit on this deal was:
(Multiple Choice)
4.8/5 (41)
Refer to the table shown. Marginal cost: Output (bicycles per week) Tatal cast (dallars) 1 100 2 200 3 310 4 440 5 580 6 730 7 900 8 1,200
(Multiple Choice)
4.8/5 (43)
The law of diminishing marginal productivity states that as more units of a variable input are added, holding other inputs constant (ceteris paribus), the additional output obtained from each new unit of the variable input eventually falls.
(True/False)
4.9/5 (39)
The following graph shows average fixed costs, average variable costs, average total costs, and marginal costs of production. 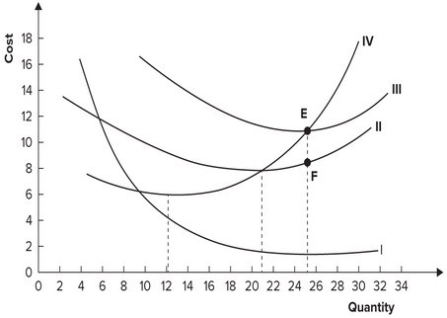 Marginal cost is minimized when output equals:
(Multiple Choice)
5.0/5 (30)
Refer to the graph shown, which shows total product. At point A: 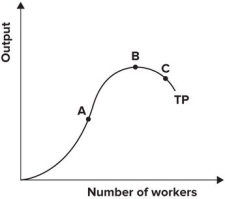
(Multiple Choice)
4.7/5 (38)
Refer to the graph shown. 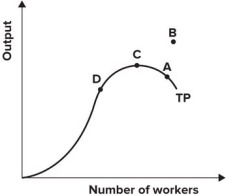 Marginal product is negative at point:
(Multiple Choice)
4.8/5 (33)
Filters
- Essay(0)
- Multiple Choice(0)
- Short Answer(0)
- True False(0)
- Matching(0)