Exam 3: A Brief Overview of the Classical Linear Regression Model
Exam 1: Introduction12 Questions
Exam 2: Mathematical and Statistical Foundations9 Questions
Exam 3: A Brief Overview of the Classical Linear Regression Model28 Questions
Exam 4: Further Development and Analysis of the Classical Linear Regression Model25 Questions
Exam 5: Classical Linear Regression Model Assumptions and Diagnostic Tests20 Questions
Exam 6: Univariate Time Series Modelling and Forecasting29 Questions
Exam 7: Multivariate Models30 Questions
Exam 8: Modelling Long-Run Relationships in Finance18 Questions
Exam 9: Modelling Volatility and Correlation22 Questions
Exam 10: Switching Models19 Questions
Exam 11: Panel Data and Limited Dependent Variable Models12 Questions
Select questions type
The point where the capital market line is tangential to the efficient frontier is
Free
(Multiple Choice)
4.9/5  (33)
(33)
Correct Answer: Verified
D
For two conformable matrices A and B, expanding the parentheses of (AB)-1 gives:
(Multiple Choice)
4.8/5 (40)
The rank of matrices A and B from the previous question are:
(Multiple Choice)
4.8/5 (38)
Consider the following graphs.
A.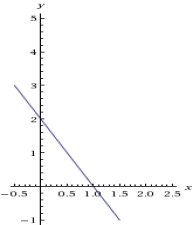 B.
B.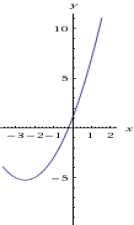 Which of the following statements is true?
(Multiple Choice)
4.8/5 (38)
Consider the following data series: 11, 10, 6, 8, 4, 3, 7. What is its semi-interquartile range of this series?
(Multiple Choice)
4.8/5 (38)
Assume that the relationship between a company's stock price (y) and dividends paid per share (x) is linear. If the slope of the equation is 0.50 and the intercept is 30, what would be the expected stock price if the dividend paid was 3?
(Multiple Choice)
4.7/5 (42)
Consider the following two graphs:
A.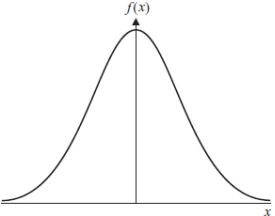 B.
B.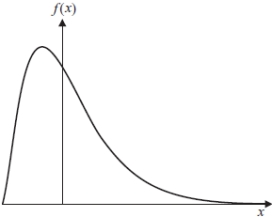 Which of the following statements is true if A represents a normal distribution?
(I) The skewness of the distribution plot A is 0 and its kurtosis is 3
(II) The skewness of the distribution plot B is 0 and its kurtosis is 3
(III) The excess kurtosis of the distribution plot A is 3
(IV) The excess kurtosis of the distribution plot B is 0
Which of the following statements is true if A represents a normal distribution?
(I) The skewness of the distribution plot A is 0 and its kurtosis is 3
(II) The skewness of the distribution plot B is 0 and its kurtosis is 3
(III) The excess kurtosis of the distribution plot A is 3
(IV) The excess kurtosis of the distribution plot B is 0
(Multiple Choice)
4.7/5 (32)
Which of the following values are closes to the roots of the following quadratic equation: ? 
(Multiple Choice)
4.9/5 (38)
What are the roots of the equation y = x2 + 2x - 6 closest to?
(Multiple Choice)
4.8/5 (32)
If A is of dimension 1 * 4 and B is of dimension 4 * 1, what is the most accurate term to describe the result of the matrix multiplication AB?
(Multiple Choice)
4.9/5 (34)
Filters
- Essay(0)
- Multiple Choice(0)
- Short Answer(0)
- True False(0)
- Matching(0)