Exam 13: Glm 2: Comparing Means Adjusted for Other Predictors Analysis of Covariance
Exam 1: Why Is My Evil Lecturer Forcing Me to Learn Statistics26 Questions
Exam 2: The Spine of Statistics26 Questions
Exam 3: The Phoenix of Statistics16 Questions
Exam 4: The Ibm Spss Statistics Environment20 Questions
Exam 5: Exploring Data With Graphs21 Questions
Exam 6: The Beast of Bias24 Questions
Exam 7: Non-Parametric Models43 Questions
Exam 8: Correlation23 Questions
Exam 9: Regression23 Questions
Exam 10: Comparing Two Means23 Questions
Exam 11: Moderation,mediation and More Regression23 Questions
Exam 12: Glm 1: Comparing Several Independent Means41 Questions
Exam 13: Glm 2: Comparing Means Adjusted for Other Predictors Analysis of Covariance22 Questions
Exam 14: Glm 3: Factorial Designs18 Questions
Exam 15: Glm 4: Repeated-Measures Designs22 Questions
Exam 16: Glm 5: Mixed Designs23 Questions
Exam 17: Multivariate Analysis of Variance Manova21 Questions
Exam 18: Exploratory Factor Analysis17 Questions
Exam 19: Categorical Outcomes: Chi-Square and Loglinear Analysis21 Questions
Exam 20: Categorical Outcomes: Logistic Regression23 Questions
Exam 21: Multilevel Linear Models20 Questions
Select questions type
Run a one-way ANOVA on the covariate data to see if the means are roughly the same across the three groups. Which of the following is correct?
Free
(Multiple Choice)
4.7/5  (43)
(43)
Correct Answer: Verified
A
Analyse the following table. How might you express the data as a multiple regression model when dummy variables are incorporated? 
Free
(Multiple Choice)
4.8/5 (31)
Correct Answer:Verified
A
Which of the following statements best describes a covariate?
Free
(Multiple Choice)
4.7/5 (38)
Correct Answer:Verified
A
Run an ANCOVA on the data. What effect do the independent variable (i.e. learning style) and covariate (i.e. motivation) have on the dependent variable (i.e. performance)?
(Multiple Choice)
4.9/5 (39)
Because the research design is slightly more complicated, partial eta squared can be used. What is the correction expression for the calculation?
(Multiple Choice)
4.7/5 (24)
Analyse the following data. What is the proportion of variance accounted for by the learning style alone? 
(Multiple Choice)
4.8/5 (31)
Based on the result in Q11, which of the statements best reflects the outcome of the one-way ANOVA?
(Multiple Choice)
4.9/5 (41)
Examine the table below. Based on the answer in Q20, calculate the partial eta squared for motivation. 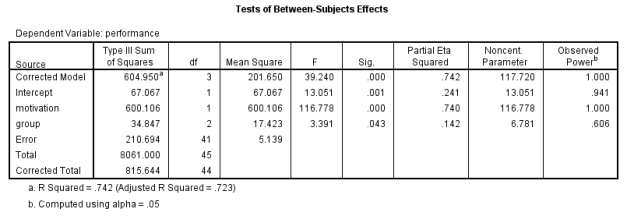
(Multiple Choice)
4.9/5 (45)
Examine the table in Q21 again and calculate the partial eta squared value for motivation.
(Multiple Choice)
4.9/5 (39)
When conducting an ANCOVA, which would be the most appropriate order?
(Multiple Choice)
4.9/5 (43)
How would you express the results of the learning style component of the ANCOVA?
(Multiple Choice)
4.9/5 (44)
What graphical illustration might you use to visually inspect the homogeneity of regression slopes (i.e. different variables)?
(Multiple Choice)
4.8/5 (36)
Analyse the following graph. The data shows the results of three groups of 15 athletes who were instructed to complete a basketball shooting exercise (success rate from 20 free throw shots) having received one of three methods of instruction, auditory (shooting technique being verbally described by a coach), visual (shooting technique being verbally described by a coach) or kinaesthetic (no coaching, just asked to perform the shooting exercise). Motivation acted as the covariate of interest. How would you describe the regression slopes? 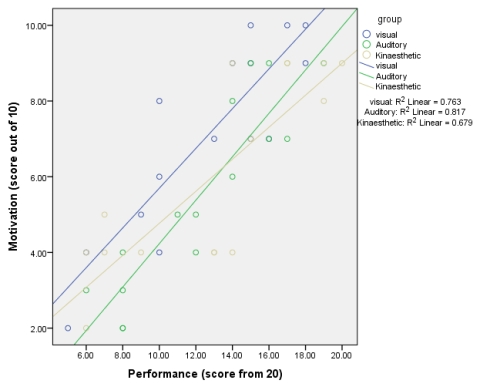
(Multiple Choice)
5.0/5 (45)
Which contrast would be most appropriate if you wished to compare each learning style against a control group (i.e. kinaesthetic)?
(Multiple Choice)
4.8/5 (39)
Analyse the following illustration. Which scenario is referable when trying to explain the impact a covariate has on an outcome variable? 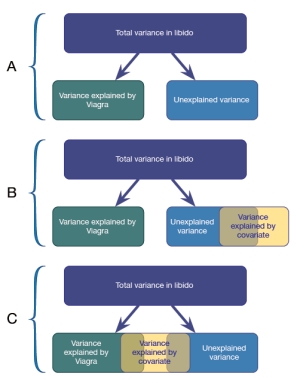
(Multiple Choice)
4.9/5 (41)
Calculate the mean and standard deviation of the kinaesthetic group from the data below. 
(Multiple Choice)
4.9/5 (37)
Having run a simple contrast with the univariate test, interpret the following table and decide which of the following statements is most appropriate. 
(Multiple Choice)
4.7/5 (35)
If you were to analyse the effect of caffeine dose (no caffeine, high and low doses) on reaction time, which of the following might be considered the most reasonable covariate?
(Multiple Choice)
4.9/5 (40)
Filters
- Essay(0)
- Multiple Choice(0)
- Short Answer(0)
- True False(0)
- Matching(0)