Exam 4: Supply and Demand: Applications and Extensions
Exam 1: The Economic Approach225 Questions
Exam 2: Some Tools of the Economist239 Questions
Exam 3: Demand, Supply, and the Market Process408 Questions
Exam 4: Supply and Demand: Applications and Extensions270 Questions
Exam 5: Difficult Cases for the Market, and the Role of Government184 Questions
Exam 6: The Economics of Political Action208 Questions
Exam 7: Consumer Choice and Elasticity229 Questions
Exam 8: Costs and the Supply of Goods222 Questions
Exam 9: Price Takers and the Competitive Process261 Questions
Exam 10: Price-Searcher Markets With Low Entry Barriers232 Questions
Exam 11: Price-Searcher Markets With High Entry Barriers260 Questions
Exam 12: The Supply of and Demand for Productive Resources154 Questions
Exam 13: Earnings, Productivity, and the Job Market91 Questions
Exam 14: Investment, the Capital Market, and the Wealth of Nations106 Questions
Exam 15: Income Inequality and Poverty105 Questions
Exam 16: Gaining From International Trade179 Questions
Select questions type
Which of the following is the most likely outcome of minimum wage laws?
(Multiple Choice)
4.8/5  (42)
(42)
Bill the butcher is upset because the government plans to tax beef $.10 a pound. "I hate paying taxes," he says. "Because of this, I'm raising all my beef prices by $.10 a pound. The consumers will bear this burden, not me." Do you see anything wrong with this way of thinking? Explain.
(Essay)
4.8/5 (36)
The term "deadweight loss" or "excess burden" is used to describe the
(Multiple Choice)
4.9/5 (35)
If the demand for a good is very price elastic, the imposition of a tax on that good
(Multiple Choice)
4.9/5 (35)
Figure 4-17 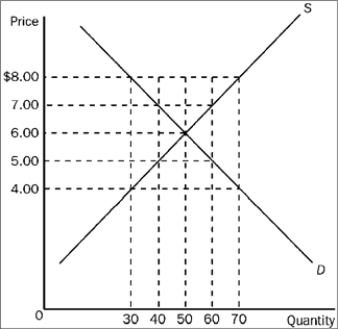 -Refer to Figure 4-17. If the government imposes a price ceiling in this market at a price of $5.00, the result would be a
(Multiple Choice)
4.8/5 (48)
Use the figure below to answer the following question(s).
Figure 4-12 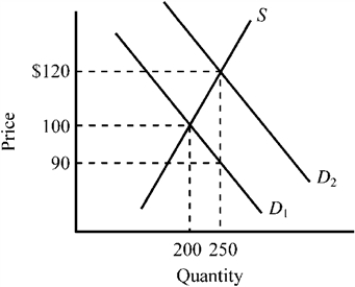 -Refer to Figure 4-12. The supply curve S and the demand curve D1 indicate initial conditions in the market for college textbooks. A new government program is implemented that grants students a $30 per textbook subsidy on every textbook they purchase, shifting the demand curve from D1 to D2. Which of the following is true for this subsidy given the information provided in the exhibit?
(Multiple Choice)
4.8/5 (41)
Use the figure below to answer the following question(s).
Figure 4-13 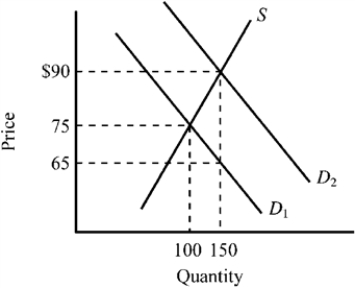 -Refer to Figure 4-13. The exhibit illustrates the impact of granting a subsidy on a particular good. Which of the following is true for this subsidy given the information provided in the exhibit?
(Multiple Choice)
5.0/5 (36)
Figure 4-21 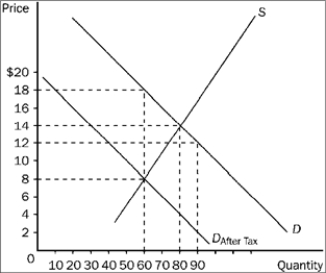 -Refer to Figure 4-21. The amount of the tax per unit is
(Multiple Choice)
4.7/5 (32)
The more inelastic the demand for a product, the more likely that the actual benefit of a subsidy granted on the product will
(Multiple Choice)
4.8/5 (43)
Figure 4-25 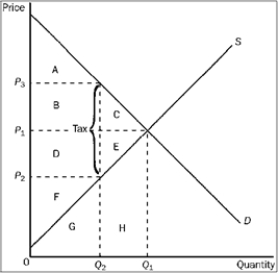 -Refer to Figure 4-25. Consumer surplus before the tax was levied is represented by area
(Multiple Choice)
4.9/5 (42)
Figure 4-21
-Refer to Figure 4-21. How much tax revenue does this tax produce for the government?
(Multiple Choice)
4.9/5 (38)
A minimum wage that is set above a market's equilibrium wage will result in
(Multiple Choice)
4.7/5 (39)
When the top marginal tax rates were lowered substantially during the 1980s, the inflation-adjusted income tax revenue collected from the top 1 percent of all income earners
(Multiple Choice)
4.7/5 (34)
Figure 4-18 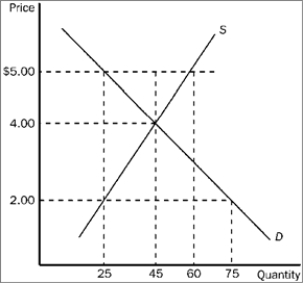 -Refer to Figure 4-18. The price of the good would continue to serve as the rationing mechanism if
(Multiple Choice)
4.8/5 (32)
Use the figure below to answer the following question(s).
Figure 4-8 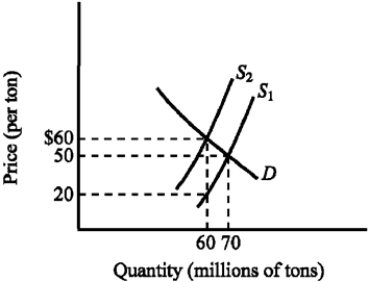 -Refer to Figure 4-8. The supply curve S1 and the demand curve D indicate initial conditions in the market for soft coal. A $40-per-ton tax on soft coal is levied, shifting the supply curve from S1 to S2. Which of the following states the actual burden of the tax?
(Multiple Choice)
4.8/5 (43)
A tax for which the average tax rate rises with income is defined as a
(Multiple Choice)
5.0/5 (31)
Use the figure below to answer the following question(s).
Figure 4-10 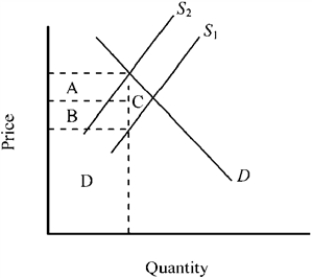 -Refer to Figure 4-10. The accompanying graph shows the market for a good before and after an excise tax is imposed. The total tax revenue generated is indicated by
(Multiple Choice)
4.7/5 (35)
Filters
- Essay(0)
- Multiple Choice(0)
- Short Answer(0)
- True False(0)
- Matching(0)