Exam 4: Supply and Demand: Applications and Extensions
Exam 1: The Economic Approach225 Questions
Exam 2: Some Tools of the Economist239 Questions
Exam 3: Demand, Supply, and the Market Process408 Questions
Exam 4: Supply and Demand: Applications and Extensions270 Questions
Exam 5: Difficult Cases for the Market, and the Role of Government184 Questions
Exam 6: The Economics of Political Action208 Questions
Exam 7: Consumer Choice and Elasticity229 Questions
Exam 8: Costs and the Supply of Goods222 Questions
Exam 9: Price Takers and the Competitive Process261 Questions
Exam 10: Price-Searcher Markets With Low Entry Barriers232 Questions
Exam 11: Price-Searcher Markets With High Entry Barriers260 Questions
Exam 12: The Supply of and Demand for Productive Resources154 Questions
Exam 13: Earnings, Productivity, and the Job Market91 Questions
Exam 14: Investment, the Capital Market, and the Wealth of Nations106 Questions
Exam 15: Income Inequality and Poverty105 Questions
Exam 16: Gaining From International Trade179 Questions
Select questions type
Which of the following statements regarding black markets is true?
(Multiple Choice)
4.8/5  (32)
(32)
Figure 4-21 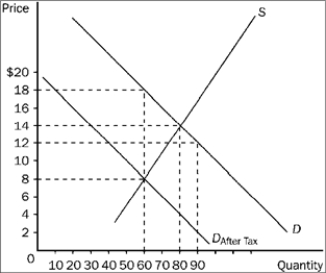 -Refer to Figure 4-21. The per-unit burden of the tax is
(Multiple Choice)
4.9/5 (36)
Other things constant, how will a decrease in the wages of teenagers affect the market for fast food hamburgers?
(Multiple Choice)
4.8/5 (40)
Use the figure below to answer the following question(s).
Figure 4-8 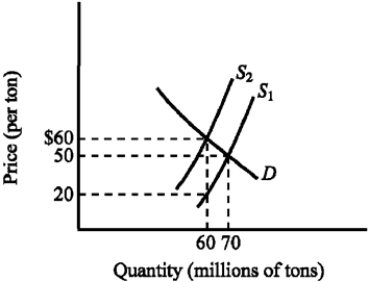 -Refer to Figure 4-8. The supply curve S1 and the demand curve D indicate initial conditions in the market for soft coal. A $40-per-ton tax on soft coal is levied, shifting the supply curve from S1 to S2. Imposing the tax increases the equilibrium price of soft coal from
(Multiple Choice)
4.8/5 (41)
If the government wants to generate large revenues from placing a tax on the consumption of a particular good, it should choose a good for which
(Multiple Choice)
4.8/5 (44)
Use the figure below illustrating the impact of an excise tax to answer the following question(s).
Figure 4-6 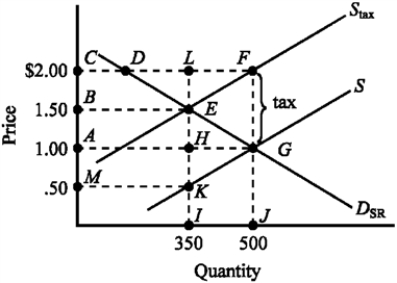 -The revenue generated by the tax illustrated in Figure 4-6 is given by the area
(Multiple Choice)
4.8/5 (44)
Figure 4-25 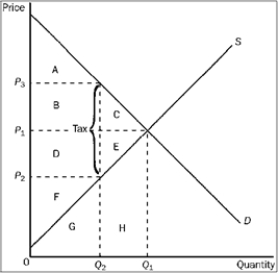 -Refer to Figure 4-25. After the tax is levied, producer surplus is represented by area
(Multiple Choice)
4.7/5 (36)
Suppose the demand curve for a good is highly elastic and the supply curve is highly inelastic. If the government taxes this good,
(Multiple Choice)
4.8/5 (29)
Suppose that a tax is placed on a particular good. If the sellers end up bearing most of the tax burden, this indicates that the
(Multiple Choice)
5.0/5 (32)
Use the figure below to answer the following question(s).
Figure 4-10 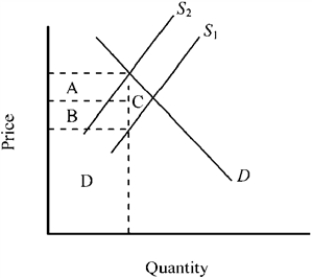 -Figure 4-10 shows the market for a good before and after an excise tax is imposed. What does the triangular area C represent?
(Multiple Choice)
4.8/5 (34)
The imposition of price ceilings on a market often results in
(Multiple Choice)
4.8/5 (40)
Use the figure below to answer the following question(s).
Figure 4-9 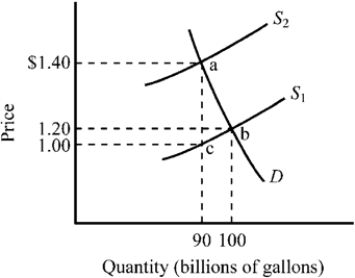 -Refer to Figure 4-9. The market for gasoline was initially in equilibrium at point b and a $.40 excise tax is illustrated. How much revenue would the $.40 gasoline tax raise?
(Multiple Choice)
4.8/5 (30)
Which of the following examples illustrates a proportional income tax?
(Multiple Choice)
4.9/5 (36)
When a supply and demand model is used to analyze the market for labor,
(Multiple Choice)
4.8/5 (41)
A price ceiling that sets the price of a good below market equilibrium will cause
(Multiple Choice)
4.8/5 (37)
Filters
- Essay(0)
- Multiple Choice(0)
- Short Answer(0)
- True False(0)
- Matching(0)