Exam 4: Supply and Demand: Applications and Extensions
Exam 1: The Economic Approach225 Questions
Exam 2: Some Tools of the Economist239 Questions
Exam 3: Demand, Supply, and the Market Process408 Questions
Exam 4: Supply and Demand: Applications and Extensions270 Questions
Exam 5: Difficult Cases for the Market, and the Role of Government184 Questions
Exam 6: The Economics of Political Action208 Questions
Exam 7: Consumer Choice and Elasticity229 Questions
Exam 8: Costs and the Supply of Goods222 Questions
Exam 9: Price Takers and the Competitive Process261 Questions
Exam 10: Price-Searcher Markets With Low Entry Barriers232 Questions
Exam 11: Price-Searcher Markets With High Entry Barriers260 Questions
Exam 12: The Supply of and Demand for Productive Resources154 Questions
Exam 13: Earnings, Productivity, and the Job Market91 Questions
Exam 14: Investment, the Capital Market, and the Wealth of Nations106 Questions
Exam 15: Income Inequality and Poverty105 Questions
Exam 16: Gaining From International Trade179 Questions
Select questions type
The state of Florida is considering putting an excise tax on either good X or good Y. An economist discovers the supply of good X is more elastic than the supply of good Y, while the demand elasticities are identical. Which good should Florida tax in order to minimize the deadweight loss of the tax?
(Essay)
4.9/5  (38)
(38)
Suppose the market equilibrium price of wheat is $5 per bushel, and the government sets a price floor of $7 per bushel to aid growers. What is the most likely result of this action?
(Multiple Choice)
4.8/5 (42)
Which of the following generalizations about the benefit of a subsidy is correct?
(Multiple Choice)
4.8/5 (40)
Use the figure below to answer the following question(s).
Figure 4-7 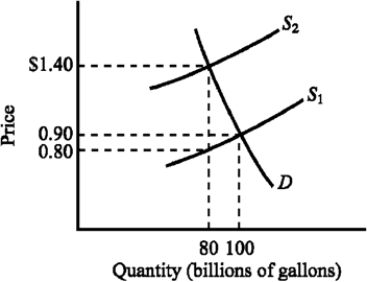 -Refer to Figure 4-7. Which of the following is true for the tax illustrated?
(Multiple Choice)
4.9/5 (37)
Use the figure below to answer the following question(s).
Figure 4-12 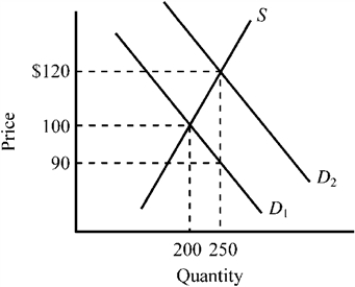 -Refer to Figure 4-12. The exhibit illustrates the impact of granting a subsidy on a particular good. Which of the following is true for this subsidy given the information provided in the exhibit?
(Multiple Choice)
4.8/5 (40)
Use the figure below to answer the following question(s).
Figure 4-7
-Refer to Figure 4-7. The supply curve S1 and the demand curve D indicate initial conditions in the market for gasoline. A $.60-per-gallon excise tax on gasoline is levied, which shifts the supply curve from S1 to S2. Imposing the tax causes the equilibrium price of gasoline to increase from
(Multiple Choice)
4.8/5 (37)
If the government wants to raise tax revenue and shift most of the tax burden to the sellers it would impose a tax on a good with a
(Multiple Choice)
4.9/5 (39)
Use the figure below to answer the following question(s).
Figure 4-10 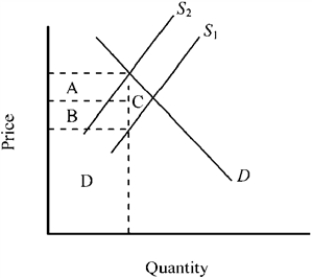 -Refer to Figure 4-11. On the Laffer curve shown, tax revenue could be increased by
(Multiple Choice)
4.8/5 (30)
Data from the effects of the substantial tax rate reductions in the 1980s
(Multiple Choice)
4.8/5 (45)
A payment the government makes to either the buyer or seller, usually on a per-unit basis, when a good or service is purchased or sold is called a
(Multiple Choice)
4.8/5 (42)
Government programs such as Medicare substantially subsidize health care purchases by some consumers in the U.S. economy. Who benefits from these subsidies? How do they affect the price of health care? If you are not a recipient of this program, are you made better or worse off by the subsidy? Explain.
(Essay)
5.0/5 (37)
The more elastic the supply of a product, the more likely it is that the
(Multiple Choice)
4.8/5 (35)
Figure 4-22 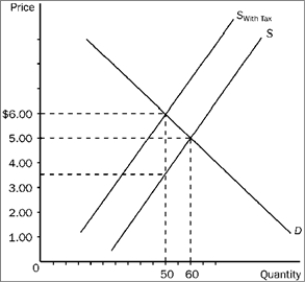 -Refer to Figure 4-22. From this tax the government will collect a total of
(Multiple Choice)
4.9/5 (40)
Figure 4-25 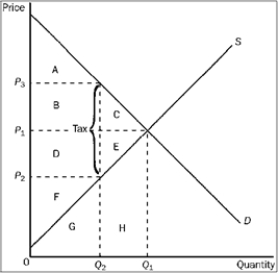 -Refer to Figure 4-25. Producer surplus before the tax was levied is represented by area
(Multiple Choice)
4.9/5 (34)
The City of Greenville needs to raise revenue. Alderman Black has proposed a $10 tax on red cars in the city, currently numbering 2,000. Mayor White, who wants more than $20,000 in revenue, proposes taxing these cars at $100 each. Councilwoman Bluestone goes even farther, suggesting a $1,000 per red car tax, arguing that her proposal will raise $2 million. If maximizing tax revenue is the only consideration, which proposal should pass? Why?
(Essay)
4.8/5 (36)
Figure 4-25
-Refer to Figure 4-25. The equilibrium price before the tax is imposed is
(Multiple Choice)
4.9/5 (43)
When several hurricanes hit Florida in 2004, a number of local governments imposed price controls that prevented sellers from raising their prices for badly needed products like plywood and generators. In the areas where the controls were imposed, they resulted in
(Multiple Choice)
4.8/5 (41)
Filters
- Essay(0)
- Multiple Choice(0)
- Short Answer(0)
- True False(0)
- Matching(0)